Saudi SME statistics: SAR 1,721 billion in revenue in 2024, 13.7% of enterprises closed, and three different business counts
GASTAT's 2024 releases in one place: SME revenue by size and sector from 2019, new and closed enterprises by activity for 2023 and 2024, and why three trusted sources give three different business counts.
 The Khaleej SEO team
Published · Updated · 11 min read
Key finding: Saudi micro, small and medium establishments earned SAR 1,720.8 billion in 2024, up 7.0% (GASTAT). The count of businesses depends on the source: 1,022,982 active enterprises of all sizes (GASTAT, 2024), 1.3 million SMEs (Monsha’at, end of 2023) or 1.7 million registers (Qoyod, 2025). In 2024, 13.7% of enterprises closed.
This page puts the General Authority for Statistics (GASTAT) releases on small business side by side: what SMEs earn by size and sector from 2019 to 2024, how many enterprises open and close in each activity, and why the headline count of Saudi SMEs changes from article to article. All sector tables are our calculations from GASTAT’s Excel files. The one odd result, a 73% jump in new enterprises with almost no change in active ones, has its own section.
Saudi SME statistics at a glance
| Figure | Value | Source and period |
|---|---|---|
| Operating revenue of micro, small and medium establishments | SAR 1,720.8 billion (+7.0%) | GASTAT, 2024 |
| Operating expenditure, employee compensation, operating surplus | SAR 762.9 billion, SAR 244.3 billion, SAR 713.5 billion | GASTAT, 2024 |
| Operating surplus as a share of revenue | 41.5% | Our calculation, 2024 |
| SME share of GDP, share of business-sector employees | 22.9%, 63% | GASTAT, 2024 |
| Active enterprises, all sizes | 1,022,982 | GASTAT business demography, 2024 |
| New and closed enterprises | 320,318 and 139,807 | GASTAT, 2024 |
| New rate, closed rate, net turnover rate | 31.3%, 13.7%, 17.6% | GASTAT, 2024 |
| Active enterprises per 1,000 adults | 37.4 | GASTAT, 2024 |
| Micro establishments’ share of SME revenue | 27.8% (small 25.8%, medium 46.3%) | Our calculation, 2024 |
| SME revenue growth, 2019 to 2024 | +48.3% | Our calculation |
| Micro share of retail revenue | 64% | Our calculation, 2024 |
Why the number of Saudi SMEs reads 1.0, 1.3 or 1.7 million
Three figures circulate for the size of the sector, and each is correct for what it counts.
| Source | Figure | What it counts |
|---|---|---|
| GASTAT, Business Demography Statistics 2024 | 1,022,982 | Active enterprises of all sizes, meaning units that carried out economic activity at any point in 2024 |
| Monsha’at SME Monitor, reported by Arab News | 1.3 million | SMEs in the fourth quarter of 2023, up 3.1% on the third quarter |
| Qoyod, Saudi SMEs 2026 report | 1.7 million | Active commercial registers of SMEs at the end of the third quarter of 2025 |
Qoyod’s report adds that a single enterprise can hold more than one register and that the number of actual enterprises is about 1.3 million, attributing that figure to Monsha’at’s observatory. Five things follow:
- The years differ (2023, 2024, 2025), and the sector was growing, so the three cannot be lined up as one trend.
- The units differ. A register is a licence; an enterprise is a business. One business can hold several registers.
- The size rule differs. GASTAT sizes by employees alone; Monsha’at classifies by employees and yearly revenue together and applies the higher size (see our small business SEO guide).
- GASTAT’s figure is smaller even though it includes large companies. We cannot reconcile it with the 1.3 million SME figure, and neither publisher gives a bridge between the two.
- Quote the source, the date and the unit, for example “1,022,982 active enterprises (GASTAT, 2024)”. A bare “1.3 million SMEs” in a pitch deck will be challenged by the first reader who has seen “1.7 million”.
SME revenue by size, 2019 to 2024
GASTAT sizes establishments by employees: micro 1 to 5, small 6 to 49, medium 50 to 249. The table gives operating revenue in SAR billion at current prices.
| Year | Micro | Small | Medium |
|---|---|---|---|
| 2019 | 322.2 | 297.1 | 541.1 |
| 2020 | 282.8 | 256.7 | 500.0 |
| 2021 | 347.6 | 318.8 | 585.3 |
| 2022 | 398.6 | 373.4 | 684.4 |
| 2023 | 445.6 | 415.2 | 747.8 |
| 2024 | 478.7 | 444.5 | 797.5 |
| 2019 to 2024 | +48.6% | +49.6% | +47.4% |
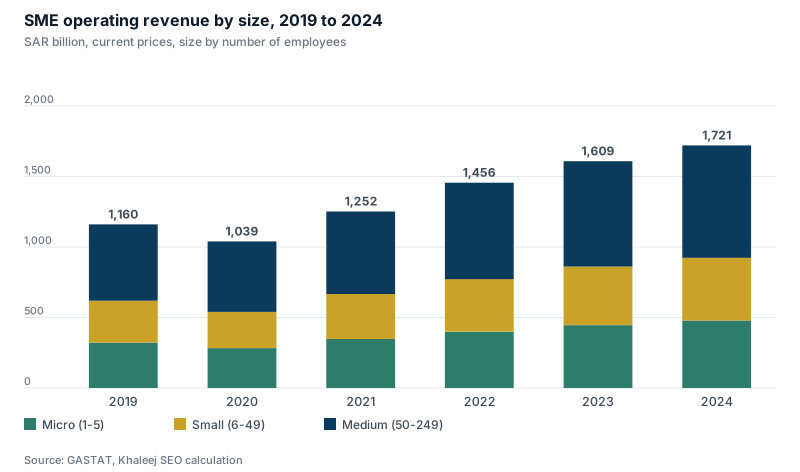
Total revenue rose 48.3% in five years, from SAR 1,160.4 billion to SAR 1,720.8 billion. Four points from the table:
- Growth was almost identical by size. Micro establishments grew 48.6%, small 49.6% and medium 47.4%. The 2024 rates were 7.4%, 7.1% and 6.7%.
- Micro establishments earn more than a quarter (27.8%, SAR 478.7 billion), small ones 25.8% and medium ones 46.3%.
- 2020 fell -10.4%, and 2021 recovered 20.4%. By 2021 revenue was above the 2019 level in all three sizes.
- Margins sit in a narrow band. Operating surplus is 40.2% of revenue for micro, 41.7% for small and 42.1% for medium establishments, and the overall margin went from 43.4% in 2019 to 41.0% in 2023 and 41.5% in 2024. Operating surplus here is revenue minus operating expenditure and employee compensation; it is not net profit, and we do not know how the survey treats owners’ pay or depreciation, so use it to compare sectors, not to say what an owner keeps.
Where SME revenue is earned and how fast it grew
The table lists the 17 sectors in GASTAT’s SME release by 2024 revenue, with growth since 2019 and the operating surplus margin.
| Sector | 2024 revenue, SAR bn | Growth 2019 to 2024 | Surplus margin |
|---|---|---|---|
| Wholesale and retail trade | 623.7 | +45.5% | 38.6% |
| Manufacturing | 332.8 | +31.9% | 39.1% |
| Construction | 270.3 | +84.3% | 45.4% |
| Accommodation and food service | 112.9 | +77.0% | 42.7% |
| Finance and insurance | 68.2 | +43.1% | 59.5% |
| Transportation and storage | 59.9 | +28.5% | 45.0% |
| Administrative and support services | 49.6 | +44.2% | 43.3% |
| Health and social work | 41.9 | +44.7% | 44.1% |
| Professional and technical activities | 39.9 | +79.4% | 42.7% |
| Other services | 32.9 | +65.1% | 31.8% |
| Information and communication | 22.7 | +25.4% | 42.0% |
| Real estate | 16.1 | +31.2% | 40.3% |
| Education | 16.0 | +12.5% | 29.5% |
| Arts, entertainment and recreation | 11.4 | +87.2% | 49.2% |
| Mining and quarrying | 9.5 | +22.9% | 57.8% |
| Electricity and gas supply | 7.7 | +15.9% | 35.0% |
| Water supply and waste management | 5.1 | +35.8% | 36.2% |
- Trade is the biggest sector at about 36% of revenue, and 65.0% of all micro-establishment revenue is in trade.
- The fastest growth since 2019 was in Arts, entertainment and recreation (+87%), Construction (+84%), Professional and technical activities (+79%) and Accommodation and food service (+77%). The slowest was Education (+12%).
- Margins range from 29.5% in education to 59.5% in finance and insurance. Trade is at 38.6%, below the all-sector 41.5%.
New and closed enterprises, 2024
GASTAT’s business demography release counts enterprises, not establishments. The new rate and the closed rate are shares of the active total in the same year. The table is sorted by closed rate.
| Sector | Active 2024 | New rate | Closed rate |
|---|---|---|---|
| Electricity and gas supply | 533 | 32.3% | 19.7% |
| Arts, entertainment and recreation | 6,144 | 28.6% | 18.2% |
| Administrative and support services | 36,975 | 24.4% | 15.3% |
| Accommodation and food service | 102,333 | 24.7% | 15.2% |
| Information and communication | 13,859 | 34.6% | 14.3% |
| Wholesale and retail trade | 326,585 | 20.9% | 14.0% |
| Water supply and waste management | 2,897 | 29.4% | 13.8% |
| Construction | 273,874 | 46.5% | 13.7% |
| Professional and technical activities | 29,714 | 25.9% | 13.2% |
| Manufacturing | 78,031 | 34.3% | 13.2% |
| Transportation and storage | 38,701 | 58.2% | 12.4% |
| Other services | 63,827 | 21.9% | 12.1% |
| Real estate | 29,240 | 23.8% | 11.8% |
| Mining and quarrying | 2,231 | 31.6% | 10.6% |
| Education | 5,620 | 23.4% | 9.2% |
| Health and social work | 8,308 | 19.9% | 6.6% |
| Finance and insurance | 4,110 | 23.5% | 5.3% |
| All activities | 1,022,982 | 31.3% | 13.7% |
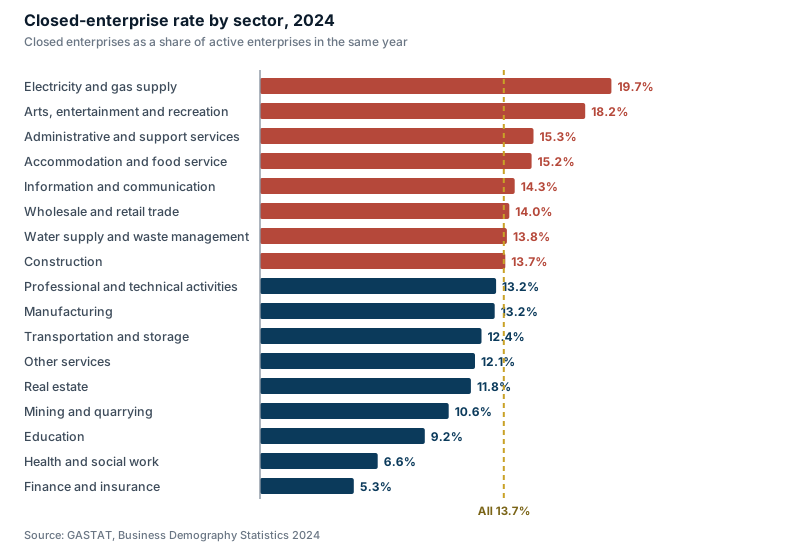
- 13.7% closed and 31.3% were new, so 17.6% net turnover (new minus closed, over active). Business density is 37.4 active enterprises per 1,000 adults.
- Electricity and gas (19.7%) and arts and entertainment (18.2%) close most often, but both sectors are small. Among the large ones, administrative services (15.3%), accommodation and food (15.2%) and trade (14.0%) are above the average.
- Finance (5.3%) and health (6.6%) close least.
- Newcomers are concentrated in a few sectors. Transportation and storage has a 58.2% new rate and construction 46.5%, against 20.9% in trade and 24.7% in accommodation and food.
Retail, restaurants, clinics, travel: the activity view
The 2024 Excel files go below sector level to ISIC divisions. The table covers eight activities that matter for stores, clinics and travel businesses. Revenue is from the SME release and the closed rate from the business demography release, both 2024, so they measure different units (establishments and enterprises).
| Activity | Revenue 2024, SAR bn | Micro share of revenue | Closed rate |
|---|---|---|---|
| Retail trade | 264.7 | 64% | 13.7% |
| Restaurants and cafes | 72.9 | 22% | 15.6% |
| Hotels and accommodation | 40.1 | 17% | 10.1% |
| Human health activities | 34.2 | 6% | 5.9% |
| Education | 16.0 | 4% | 9.2% |
| Advertising and market research | 8.1 | 20% | 18.7% |
| Software and IT consulting | 6.5 | 12% | 11.5% |
| Travel agencies and tour operators | 5.1 | 24% | 12.7% |
- Retail is a market of very small shops. Establishments with 1 to 5 employees earn 64% of SME retail revenue (SAR 264.7 billion). In health the micro share is 6% and in education 4%.
- Restaurants and cafes close 2.6 times as often as health activities (15.6% against 5.9%), and their closed rate rose from 13.3% in 2023.
- Travel agencies are small and getting less stable: SAR 5.1 billion of SME revenue, and the closed rate moved from 8.7% to 12.7% in a year.
- Hotels have the widest margin of the eight (54.4% of revenue as operating surplus), while education has the highest staff cost (36.5% of revenue goes to employee compensation).
The numbers that do not reconcile
GASTAT’s business demography series began in 2023, so there are two years to compare. The headline figures are in the table.
| Measure | 2023 | 2024 |
|---|---|---|
| Active enterprises | 1,019,592 | 1,022,982 |
| New enterprises | 185,597 | 320,318 |
| Closed enterprises | 120,184 | 139,807 |
| New rate | 18.2% | 31.3% |
| Closed rate | 11.8% | 13.7% |
New enterprises rose 73%, closed enterprises rose 16%, and active enterprises rose 3,390, or 0.3%. If you take the 2023 active total, add 2024’s new enterprises and subtract 2024’s closed ones, you get 1,200,103, which is 177,121 more than the published 1,022,982. GASTAT defines active enterprises as units that carried out economic activity at any point in the period and says the series is comparable over time. We found no note that explains the difference.
The gap is not one sector. New enterprises rose in 17 of 17 sectors, while active enterprises rose in only 14:
| Sector | New, 2023 to 2024 | Change in active |
|---|---|---|
| Construction | 47,009 to 127,488 | +36,873 |
| Manufacturing | 11,050 to 26,786 | +2,643 |
| Transportation and storage | 8,904 to 22,520 | +12,630 |
| Wholesale and retail trade | 55,615 to 68,382 | -53,617 |
| Accommodation and food service | 21,269 to 25,290 | +448 |
| All activities | 185,597 to 320,318 | +3,390 |
Construction new enterprises went from 47,009 to 127,488 (2.7 times) and the active count rose 36,873. Trade is the opposite case: 68,382 new and 45,634 closed in 2024, yet active enterprises fell from 380,202 to 326,585, which is 53,617 fewer (14%).
What to do with this:
- Use each year’s rates (new rate, closed rate, net turnover) as GASTAT publishes them, and do not read new minus closed as net growth.
- Do not trend the 2023 and 2024 flows as a growth story. A “73% rise in new businesses” headline would rest on counts that do not tie to the active totals.
- Treat this as a question for the publisher, not as a finding about the economy. The data does not say why, and we do not claim a cause.
What this means for SEO
This section is our analysis, not a source figure.
- Stores: you compete with very small shops. 64% of SME retail revenue is earned by 1 to 5 person establishments, and about one retail enterprise in five is new each year (20.3%). Your search competitors change every year, so product pages, category pages and reviews need steady work. See our guides to e-commerce SEO and Salla versus Zid.
- Restaurants and cafes: local search is the first channel. The closed rate is 15.6% and the average restaurant establishment is small, so map visibility and fresh reviews matter more than a large site. Our Google Business Profile management guide covers the basics.
- Clinics: low closure, high staff cost. Health closes at 5.9% and 26.9% of revenue goes to employee compensation, so each new patient from search has to be worth the chair time. The Saudi dental statistics page and our dental SEO service go further.
- Travel companies: a small, less stable group. With SAR 5.1 billion of SME revenue and a closed rate of 12.7%, brand search and direct bookings are worth protecting. See our travel SEO service and the Saudi tourism statistics.
- Name the unit and the date when you size a market. A pitch, a plan or a keyword model that says “1.3 million SMEs” should say whose figure it is. The difference between 1.0 and 1.7 million is larger than most campaign budgets.
How many of these businesses are online? GASTAT’s 2025 ICT survey finds 35.1% of establishments with a website and 66.3% on social media, and our Saudi businesses online statistics page tests whether those shares line up with the closure and growth figures above. They do not, clearly.
For a plan built on your own data, a free SEO audit shows what Google sees today, and the SEO agency in Saudi Arabia page explains how we work with small and growing businesses. The card-spending side of the same market is in our posts on spending by sector and by city; for how long results take, read how long SEO takes.
Methodology and sources
- GASTAT, Small and Medium Establishments Statistics 2024 (Excel and PDF summary on stats.gov.sa). Operating revenue, operating expenditure, employee compensation and operating surplus by economic activity and establishment size, 2019 to 2024, in thousand SAR. Sizes: micro 1 to 5 employees, small 6 to 49, medium 50 to 249. We checked the Excel totals against GASTAT’s PDF (revenue SAR 1,720.8 billion, +7.0%; expenditure SAR 762.9 billion, +5.7%; compensation SAR 244.3 billion, +7.1%; micro SAR 478.7 billion, small SAR 444.5 billion, medium SAR 797.5 billion) and the sector sums against the totals. Operating surplus equals revenue minus expenditure minus compensation in every row we tested.
- GASTAT, Business Demography Statistics 2024 and 2023 (Excel and PDF summaries). Active, new and closed enterprises by economic activity. The 2024 file adds the definition of an enterprise, the rates and business density. Our new and closed rates equal GASTAT’s published rates for all 17 sectors and the eight divisions shown. The series began in 2023 and GASTAT says it is comparable over time.
- Other sources named in the count section: Arab News, “Saudi Arabia’s SMEs grow 3.1% to 1.3m: Monsha’at” (reporting the Monsha’at SME Monitor for the fourth quarter of 2023), and Qoyod, “Saudi SMEs 2026” (published 30 June 2026), cited as reported and not recomputed.
- Our calculations: shares, growth, margins, closed and new rates for the divisions, the size comparison and the reconciliation. Values are rounded to the digits shown; trade’s share of revenue reads 36.2% from the Excel and 36.3% in GASTAT’s text, a rounding difference.
- Limits: revenue is in current riyals with no price adjustment; the SME release covers establishments and the demography release covers enterprises, so do not divide one by the other; operating surplus is not profit; GASTAT’s own 2023 and 2024 flows do not tie to the active totals; the time series has 17 sectors and the ISIC division detail covers 2024 only; Monsha’at’s figure is cited as reported by Arab News, and no paid dataset or survey claim was used.
Free downloads: saudi-sme-revenue-by-size-sector.csv holds revenue, expenditure, compensation and surplus for 17 sectors and 3 sizes, 2019 to 2024. saudi-sme-division-detail-2024.csv holds the same four measures for 87 activities in 2024. saudi-enterprises-active-new-closed.csv holds active, new and closed enterprises with our rates for 2023 and 2024.
How to cite this page
Khaleej SEO, “Saudi SME statistics: SAR 1,721 billion in revenue in 2024, 13.7% of enterprises closed”, khaleejseo.com/blog/saudi-sme-statistics/, updated 31 October 2026. Name GASTAT as the source of the underlying figures. The charts and the CSV files may be reused with this credit and a link.
Updates
- 31 October 2026: first published, with GASTAT’s 2024 SME and business demography releases. We will add GASTAT’s next releases when they appear on stats.gov.sa, and re-read the reconciliation section if GASTAT explains the gap.
Licence: the compilation, calculations, charts and CSV files on this page are shared under CC BY 4.0: credit Khaleej SEO and link to this page. Source figures stay under their publisher's terms, so credit the source named next to each figure.
Arabic and English SEO specialists for e-commerce stores, dental clinics and travel companies. Our team has led SEO for some of the largest e-commerce brands in the Gulf, across 7 MENA markets.