Saudi card spending by sector: electronics fell 23.6% from 2021 to 2024 while total spending rose 40.6%
SAMA's weekly point of sale data by sector: 19 groups ranked, three years of share and growth for 17 groups, the average payment in each, and the 2025 change in SAMA's sector groups that breaks year-on-year comparisons.
 The Khaleej SEO team
Published · Updated · 10 min read
Key finding: Point of sale spending on electronics fell 23.6% between 2021 and 2024 while total spending rose 40.6%, and fell another 28.5% in early 2025. In the newest data, food and beverages and restaurants and cafes take 27.0% of SAR 547.5 billion. SAMA changed its sector groups in mid-2025, so the series cannot be joined.
This page ranks the 19 sector groups in SAMA’s newest weekly point of sale report, follows 17 groups for three years in the older series, and shows where the two series disagree. Weekly news items give one week at a time; here the question is how the split between sectors changes over years. The card data counts payments in shops, restaurants and other points of sale, not online orders, and the method section says what it can and cannot show.
Saudi card spending by sector at a glance
| Figure | Value | Source and period |
|---|---|---|
| Food and beverages plus restaurants and cafes | 27.0% of SAR 547.5 billion | SAMA via KAPSARC, 29 June 2025 to 22 March 2026 |
| Largest group, “Other” | 16.1% (SAR 88.4 billion) | Same period |
| Health | 6.2% (SAR 34.1 billion), of which medical services 3.5% (SAR 19.1 billion) | Same period |
| Average payment, all sectors | SAR 61.0 over 9.0 billion payments | Same period, our calculation |
| Total spending, 2021 to 2024 | +40.6% (SAR 472.4 billion to SAR 664.4 billion) | Older series, our calculation |
| Electronics and electrical devices, 2021 to 2024 | -23.6% (SAR 14.7 billion to SAR 11.2 billion), share 3.1% to 1.7% | Older series, our calculation |
| Hotels, 2021 to 2024 | +70.3%, share 1.9% to 2.3% | Older series, our calculation |
| Health, 2021 to 2024 | +16.1%, share 7.5% to 6.2% | Older series, our calculation |
| Average payment, all sectors | SAR 91.4 (2021) to SAR 64.4 (2024), lower in 16 of 17 groups | Older series, our calculation |
| First 27 weeks of 2025 against 2024 | total +6.4%, electronics -28.5%, jewelry +28.5% | Older series, our calculation |
| Same-named groups that match in both series | 3 of 16 | Overlap weeks, 29 June and 6 July 2025 |
The 19 sector groups ranked
SAMA’s newest weekly table splits spending into 19 groups and 11 sub-sectors. The table shows the 19 groups for the 39 weeks from 29 June 2025 to 22 March 2026, when point of sale spending was SAR 547.5 billion. The average payment is spending divided by the number of transactions.
| Sector | SAR billion | Share | Avg payment, SAR |
|---|---|---|---|
| 1. Other | 88.4 | 16.1% | 57.4 |
| 2. Food and beverages | 83.5 | 15.3% | 40.8 |
| 3. Restaurants and cafes | 64.1 | 11.7% | 29.9 |
| 4. Apparel, clothing and accessories | 48.7 | 8.9% | 123.6 |
| 5. Transportation | 39.3 | 7.2% | 166.7 |
| 6. Gas stations | 38.0 | 6.9% | 56.9 |
| 7. Professional and business services | 34.1 | 6.2% | 65.9 |
| 8. Health | 34.1 | 6.2% | 87.7 |
| 9. Furniture and home supplies | 20.6 | 3.8% | 191.4 |
| 10. Jewelry | 16.5 | 3.0% | 1,333.9 |
| 11. Construction and building materials | 15.8 | 2.9% | 164.3 |
| 12. Recreation and culture | 13.7 | 2.5% | 88.7 |
| 13. Hotels | 13.1 | 2.4% | 419.7 |
| 14. Bakeries and pastries | 10.4 | 1.9% | 39.1 |
| 15. Education | 8.8 | 1.6% | 1,200.8 |
| 16. Electronics and electrical devices | 7.5 | 1.4% | 106.0 |
| 17. Telecommunication | 6.9 | 1.3% | 43.6 |
| 18. Laundry services | 2.1 | 0.4% | 19.0 |
| 19. Public utilities and services | 2.0 | 0.4% | 65.2 |
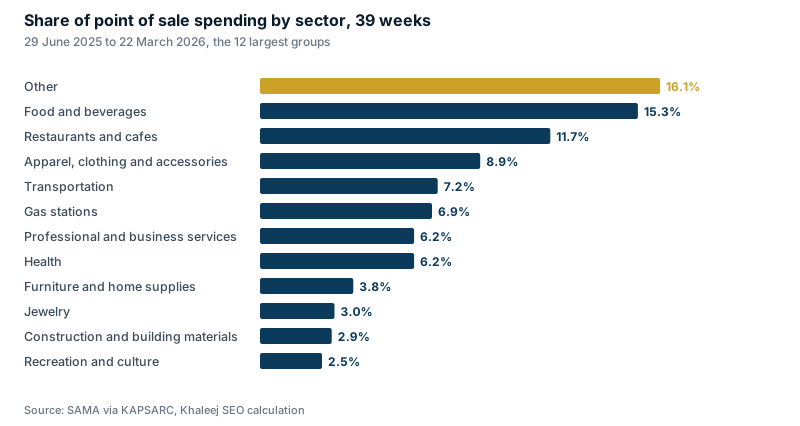
Six points from the ranking:
- Two food groups take over a quarter. Food and beverages (SAR 83.5 billion) and restaurants and cafes (SAR 64.1 billion) hold 27.0%, and bakeries and pastries add 1.9% more. Their average payments are small (SAR 40.8 and SAR 29.9), so they are the most frequent payments in the data.
- The two largest rows do not say what was bought. “Other” (16.1%) is the biggest group, and professional and business services (6.2%) is also broad. Together they hold 22.4% of spending, so any ranking of named sectors leaves more than a fifth of the money unexplained.
- Apparel is the largest named retail group at 8.9% (SAR 48.7 billion), with an average payment of SAR 123.6.
- Gas stations rank 6th (6.9%). One week in the source copy needed a correction, described in the method section.
- Health ranks 8th (6.2%, SAR 34.1 billion), with an average payment of SAR 87.7.
- Four groups have large average payments: jewelry (SAR 1,334), education (SAR 1,201), hotels (SAR 419.7) and furniture and home supplies (SAR 191.4). Electronics and electrical devices is 16th with 1.4% (SAR 7.5 billion), a point the next sections come back to.
Inside health, transport and recreation
Three groups are split into sub-sectors. The table gives each sub-sector’s share of all point of sale spending.
| Sub-sector | SAR billion | Share of all spending | Avg payment, SAR |
|---|---|---|---|
| Health: Medical services | 19.1 | 3.5% | 150.3 |
| Health: Pharmacies and medical supplies | 9.8 | 1.8% | 62.8 |
| Health: Personal care | 5.1 | 0.9% | 48.6 |
| Transportation: Vehicles and spare parts | 20.4 | 3.7% | 278.8 |
| Transportation: Vehicle repair and maintenance | 9.2 | 1.7% | 92.1 |
| Transportation: Other transport | 3.0 | 0.5% | 81.9 |
| Transportation: Car and equipment rental | 2.8 | 0.5% | 268.7 |
| Transportation: Freight, postal and courier | 2.0 | 0.4% | 186.2 |
| Transportation: Airlines | 1.9 | 0.3% | 350.3 |
| Recreation and culture: Recreation | 8.7 | 1.6% | 81.6 |
| Recreation and culture: Books and stationery | 5.0 | 0.9% | 104.5 |
Medical services are SAR 19.1 billion, or 56.2% of the health group, and pharmacies and medical supplies are 28.8%. A medical services payment averages SAR 150.3, about 2.4 times a pharmacy payment (SAR 62.8). Vehicles and spare parts are the largest transport row (SAR 20.4 billion, 3.7%) with an average of SAR 278.8. Airlines show only 0.3% (SAR 1.9 billion): tickets paid online are outside this report, so the row cannot size the airline sector.
Three years of change, 2021 to 2024
The newest table cannot be compared with earlier years (see the section on SAMA’s change below), so for the trend we use the older series, which has 17 groups and runs to 6 July 2025. Each year is made of the weeks that start in it: 52 weeks in 2021 and in 2024. The table gives each group’s share of all point of sale spending in % for 2021 and 2024 and the change in value in %; the change in share in percentage points is in the CSV.
| Sector | Share 2021, % | Share 2024, % | Value, % |
|---|---|---|---|
| Miscellaneous goods and services | 9.2 | 12.2 | +86.2 |
| Hotels | 1.9 | 2.3 | +70.3 |
| Other | 13.7 | 16.3 | +67.1 |
| Gas stations | 5.8 | 6.8 | +64.9 |
| Education | 1.4 | 1.5 | +53.8 |
| Restaurants and cafes | 13.2 | 14.4 | +53.7 |
| Transportation | 5.4 | 5.7 | +47.2 |
| Food and beverages | 15.4 | 15.3 | +39.8 |
| Clothing and footwear | 8.0 | 6.9 | +19.9 |
| Telecommunication | 1.1 | 0.9 | +16.6 |
| Health | 7.5 | 6.2 | +16.1 |
| Jewelry | 2.7 | 2.0 | +5.7 |
| Recreation and culture | 3.0 | 2.2 | +3.6 |
| Public utilities | 0.9 | 0.6 | -7.2 |
| Construction and building materials | 4.0 | 2.7 | -7.3 |
| Furniture | 3.6 | 2.4 | -8.4 |
| Electronics and electrical devices | 3.1 | 1.7 | -23.6 |
| Saudi Arabia, all sectors | 100 | 100 | +40.6 |
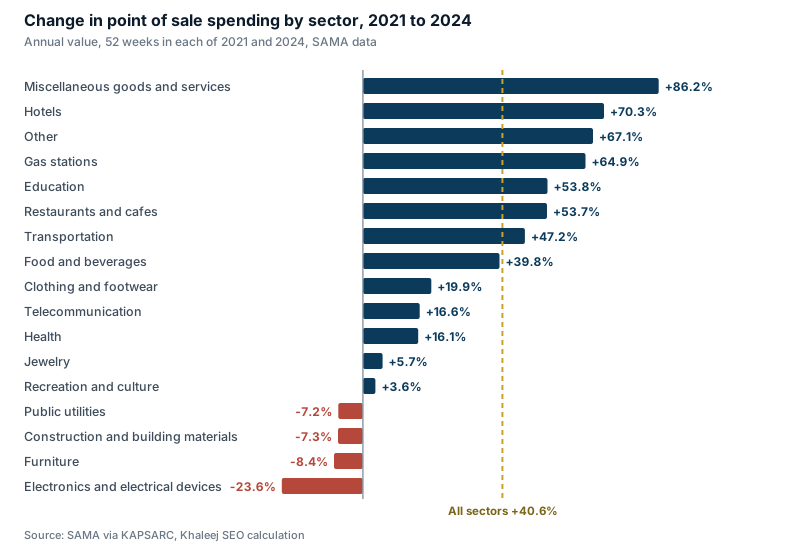
Total spending grew 40.6%, and 13 of 17 groups grew. Five points from the table:
- Four groups shrank in value: electronics and electrical devices (-23.6%), furniture (-8.4%), construction and building materials (-7.3%) and public utilities (-7.2%).
- Electronics lost the most. Its share fell from 3.1% to 1.7% and its value from SAR 14.7 billion to SAR 11.2 billion, while the number of payments rose 64.6% and the average payment fell 53.6%. More payments, each less than half the size. The report does not count online payments, and we cannot test whether spending moved there.
- Hotels grew 70.3% and their share rose from 1.9% to 2.3%, the second-fastest growth of the 17 groups after miscellaneous goods and services.
- Health grew 16.1%, less than half the rate of total spending (40.6%), and its share fell from 7.5% to 6.2%.
- The unspecified rows grew. “Other” and “Miscellaneous goods and services” together went from 22.9% to 28.5% of spending, so by 2024 more than a quarter sat in rows that do not name a product. Restaurants and cafes rose from 13.2% to 14.4% while food and beverages held at 15.4% and 15.3%.
We can show what changed. The data does not say why, and we do not name a cause.
Average payments fell in 16 of 17 groups
For all sectors the average payment, which is spending divided by the number of transactions, was SAR 91.4 in 2021 and SAR 64.4 in 2024. Our post on Saudi digital payments reports the same direction on SAMA’s monthly national series.
| Sector | 2021, SAR | 2024, SAR | Change |
|---|---|---|---|
| Telecommunication | 256.6 | 81.5 | -68.2% |
| Electronics and electrical devices | 404.8 | 187.8 | -53.6% |
| Construction and building materials | 415.0 | 216.7 | -47.8% |
| Furniture | 379.9 | 240.0 | -36.8% |
| Other | 108.4 | 69.4 | -35.9% |
| Recreation and culture | 162.1 | 114.0 | -29.7% |
| Transportation | 362.4 | 263.1 | -27.4% |
| Miscellaneous goods and services | 95.1 | 69.2 | -27.3% |
| Food and beverages | 56.3 | 41.4 | -26.5% |
| Public utilities | 97.8 | 72.1 | -26.3% |
| Restaurants and cafes | 43.2 | 32.9 | -23.8% |
| Clothing and footwear | 173.1 | 133.6 | -22.8% |
| Education | 1,729.0 | 1,369.0 | -20.8% |
| Health | 121.1 | 100.6 | -17.0% |
| Gas stations | 57.5 | 55.5 | -3.4% |
| Jewelry | 1,164.6 | 1,149.3 | -1.3% |
| Hotels | 363.7 | 422.2 | +16.1% |
| Saudi Arabia, all sectors | 91.4 | 64.4 | -29.6% |
Telecommunication (68.2%) and electronics (53.6%) fell the most, and hotels are the only group that rose (SAR 363.7 to SAR 422.2). Jewelry barely moved (SAR 1,165 to SAR 1,149). The average mixes what people buy with how they pay, so a lower figure can mean smaller baskets, more frequent payments or a different mix of shops, and the data cannot separate these.
Latest read: the first 27 weeks of 2025
Our older series ends on 6 July 2025, which gives 27 weeks in 2025. The table compares them with the first 27 weeks of 2024, with the same groups.
| Sector | 2024, SAR billion | 2025, SAR billion | Change |
|---|---|---|---|
| Jewelry | 7.1 | 9.2 | +28.5% |
| Other | 54.8 | 67.1 | +22.4% |
| Gas stations | 22.5 | 24.9 | +10.7% |
| Clothing and footwear | 24.7 | 26.7 | +8.0% |
| Telecommunication | 2.9 | 3.1 | +6.7% |
| Miscellaneous goods and services | 41.8 | 44.3 | +5.9% |
| Health | 20.9 | 21.7 | +4.0% |
| Education | 3.8 | 3.9 | +3.5% |
| Transportation | 18.9 | 19.5 | +3.2% |
| Restaurants and cafes | 48.8 | 50.0 | +2.4% |
| Food and beverages | 53.2 | 53.7 | +0.9% |
| Hotels | 8.0 | 8.0 | +0.6% |
| Construction and building materials | 8.8 | 8.8 | -0.1% |
| Furniture | 8.1 | 8.0 | -1.7% |
| Recreation and culture | 7.6 | 7.3 | -3.2% |
| Electronics and electrical devices | 6.1 | 4.4 | -28.5% |
| Public utilities | 2.3 | 1.4 | -39.2% |
| Saudi Arabia, all sectors | 340.3 | 362.0 | +6.4% |
Total spending grew 6.4%, much slower than the three-year pace. Jewelry (+28.5%) and “Other” (+22.4%) grew fastest, gas stations grew +10.7% and clothing and footwear +8.0%. Electronics fell 28.5%, so the decline of 2021 to 2024 continued. Public utilities fell 39.2% from a small base (SAR 2.3 billion in the same weeks of 2024), so read that row with care.
SAMA changed its sector groups in mid-2025
KAPSARC publishes SAMA’s weekly report in two datasets: an older one with 17 groups that ends on 6 July 2025, and a detailed one with 19 groups and 11 sub-sectors that starts on 29 June 2025. Two weeks (29 June and 6 July 2025) are in both, so we can compare them directly; the table adds the two weeks, in SAR million, for the groups that carry the same name, older series first. In both, the all-sector total is the same (SAR 27.4 billion for the two weeks), but the groups are not.
| Sector | Older | Newer | Gap |
|---|---|---|---|
| Furniture | 566 | 1,010 | +78.5% |
| Transportation | 1,499 | 2,061 | +37.6% |
| Telecommunication | 254 | 332 | +30.7% |
| Recreation and culture | 548 | 716 | +30.7% |
| Construction and building materials | 674 | 827 | +22.6% |
| Health | 1,676 | 2,010 | +19.9% |
| Other | 5,533 | 4,490 | -18.8% |
| Restaurants and cafes | 3,874 | 3,409 | -12.0% |
| Education | 243 | 267 | +9.8% |
| Jewelry | 637 | 690 | +8.3% |
| Electronics and electrical devices | 355 | 384 | +8.0% |
| Clothing and footwear | 1,720 | 1,823 | +6.0% |
| Gas stations | 1,923 | 1,925 | +0.1% |
| Food and beverages | 3,975 | 3,975 | 0.0% |
| Public utilities | 105 | 105 | 0.0% |
| Hotels | 542 | 542 | 0.0% |
| All sectors | 27,427 | 27,427 | 0.0% |
Of the 16 groups that have the same name in both series, only 3 match (food and beverages, hotels and public utilities), gas stations differ by 0.1%, and the other 12 differ by 6.0% to 78.5%. Health is SAR 1676.5 million in the older series and SAR 2009.6 million in the newer, and furniture grows from SAR 565.7 million to SAR 1009.9 million because the newer group is “Furniture and home supplies”. Restaurants and cafes and “Other” are smaller in the newer series. “Miscellaneous goods and services” has no same-named group in the newer series, so it is not in the table.
For anyone who reads sector data, the consequence is practical: do not compare a sector share from 2025 or 2026 with one from 2024 or earlier, except for the three groups that match. That is why this page ranks the newest series on its own and reads the trend only in the older one. We matched groups by name; we found no crosswalk between the two series in the dataset text.
What this means for SEO
This section is our analysis, not a source figure.
- Clinics: plan for fewer, larger payments and a slower market. Medical services average SAR 150.3 a payment, 2.4 times a pharmacy payment, and the health group grew 16.1% from 2021 to 2024 against 40.6% for everything. Growth in the market will not lift a clinic by itself; winning a larger share of the searches for treatments will. Our dental SEO service covers those pages, and the dental statistics post has the supply side.
- Electronics and furniture stores: check your own data before you read this as bad news. Point of sale spending on both fell from 2021 to 2024, but online payments are outside the report. Put your Search Console clicks and GA4 orders for the same categories next to these figures. Our posts on electronics and appliance stores, furniture stores and Saudi e-commerce statistics have the online side.
- Jewelry: one payment is worth a lot. The average payment is SAR 1,149 and spending grew 28.5% in the first 27 weeks of 2025. With so few payments, each product page needs trust content (certificates, return terms, photos) and each missed click costs more. See our jewellery store SEO guide.
- Hotels and travel: a growing group with larger payments. Hotels grew 70.3% from 2021 to 2024 and are the one group whose average payment rose. Travel and hospitality pages should lead with what the stay includes, not a discount. Our Saudi tourism statistics and travel SEO pages go with this.
- Do not use one sector share across the 2025 change. If a market report gives a sector share for 2024 and another for 2025, ask which series each uses. A drop in furniture or a rise in health between them may be the change in definition.
- Read the unspecified rows as a warning. More than a quarter of spending sits in “Other” and “Miscellaneous” rows, so a keyword plan built only on named sectors will miss part of the demand. Start from your own Search Console queries.
If you want your own category split read from your data, a free SEO audit shows what Google sees today, and our SEO agency in Saudi Arabia page explains how we work with stores, clinics and travel businesses. For the same data by city see Saudi card spending by city, and for the weeks around sales and holidays see Saudi shopping seasons. For what small businesses earn by sector and how many close each year, see Saudi SME statistics.
Methodology and sources
- SAMA, weekly point of sale transactions by sector and city, as republished by the KAPSARC Data Portal (datasource.kapsarc.org), published under “Public Domain” with SAMA as the publisher. Two datasets were used, in their national rows (all cities): “Point of Sale Transactions by Sector and City” (31,262 records, weeks starting 10 May 2020 to 6 July 2025, 17 sector groups and the total) and “Detailed Point of Sale Transactions by Sector and City” (14,168 records, weeks starting 29 June 2025 to 22 March 2026, 19 groups, 11 sub-sectors and the total). Record counts, date ranges and modification dates were read from the portal’s API on 30 October 2026 and match our files.
- Series. The newest figures (ranking, sub-sectors, average payments) use only the newer series, 39 weeks. The trend from 2021 to 2024 uses only the older series. We did not join them for any sector, for the reason given in the section on SAMA’s change. In the older series the 17 groups add up to the total row in every week within rounding, and in the newer the 19 groups add up to the total row within SAR 4,000 in every week except one, described next.
- One entry corrected. In the newer series the gas stations value for the week starting 1 February 2026 reads SAR 63.3 million, against SAR 1062.8 million and SAR 971.1 million in the weeks either side, while the total row of that week is SAR 940.8 million higher than the sum of the 19 groups (every other week matches within SAR 4,000). We treat it as an entry error in the copy and use the total row minus the other 18 groups for that cell, SAR 1004.1 million. Without the correction gas stations would read SAR 37.1 billion (6.8%) instead of SAR 38.0 billion (6.9%). The nearby transaction count is normal. We have not seen SAMA’s own table for that week.
- Check against SAMA’s monthly series. Our calendar-year totals for the older series are SAR 472.4 billion for 2021 and SAR 664.4 billion for 2024, against SAR 473.3 billion and SAR 668.2 billion in the monthly series used in our Saudi digital payments post (within 0.6%, the difference of weeks against months), and the average payments (SAR 91.4 and SAR 64.4) match its SAR 91.52 and SAR 64.41.
- Value and average payment. Value is in thousand SAR as published and shown in SAR billion or million. The average payment is value divided by the number of transactions, both as published.
- Years. Each calendar year is made of the weeks that start in it. 2021 and 2024 both have 52 weeks. For the 2025 comparison we used the 27 weeks from 5 January to 6 July 2025 and the 27 weeks from 7 January to 7 July 2024.
- Our calculations: group shares, change in value and in share, average payment, the first-27-weeks comparison, the overlap table and the 39-week ranking. Values are rounded to the digits shown.
- Limits: the data counts payments at points of sale in Saudi Arabia and does not include online orders, cash or bank transfers. We assume the older series kept the same 17 groups from 2021 to 2024; its text does not announce a change and the shares add to 100% every year, but we cannot test it. The newer series ends with the week starting 22 March 2026. We did not adjust for prices, so the growth figures are in current riyals. Causes are not stated because the data does not give them. We used no retailer announcements, paid datasets or survey claims.
Free downloads: saudi-card-spending-by-sector.csv holds the 19 groups and 11 sub-sectors with value, share, transactions and average payment for the 39 weeks. saudi-sector-share-by-year.csv holds the 17 groups for 2021 to 2024 with the first-27-weeks comparison. saudi-sector-classification-overlap.csv holds the two-series comparison.
How to cite this page
Khaleej SEO, “Saudi card spending by sector: electronics fell 23.6% from 2021 to 2024 while total spending rose 40.6%”, khaleejseo.com/blog/saudi-card-spending-by-sector/, updated 30 October 2026. Name SAMA, through the KAPSARC Data Portal, as the source of the card data. The charts and the CSV files may be reused with this credit and a link.
Updates
- 30 October 2026: first published, with SAMA weekly data to the week starting 22 March 2026. We will add newer weeks when the KAPSARC archive carries them, and re-read the overlap table if SAMA publishes a crosswalk between the two series.
Licence: the compilation, calculations, charts and CSV files on this page are shared under CC BY 4.0: credit Khaleej SEO and link to this page. Source figures stay under their publisher's terms, so credit the source named next to each figure.
Arabic and English SEO specialists for e-commerce stores, dental clinics and travel companies. Our team has led SEO for some of the largest e-commerce brands in the Gulf, across 7 MENA markets.