Saudi dental statistics 2026: dentists by region, sector and nationality
Official Ministry of Health figures on dentists in Saudi Arabia, 2017 to 2024: how many there are, where they work, how many are Saudi, and which regions have the most private-sector dentists per resident, with our own analysis and a free CSV.
 The Khaleej SEO team
Published · Updated · 7 min read
Key figures: Saudi Arabia had 33,751 dentists in 2024, or 9.5 for every 10,000 people, according to the Ministry of Health (MOH) Statistical Yearbook 2024. 60.0% of them work in the private sector, 58.1% are Saudi, and 37.4% are in the Riyadh region, which holds 26.7% of the population. Riyadh has 8.8 private-sector dentists per 10,000 residents, the highest of any region.
This page collects the official Saudi dental workforce statistics in one place, with the table and cell each number comes from, and adds our own regional analysis for clinic owners and marketers. Compiled by the Khaleej SEO research team from the MOH yearbooks opened on 6 October 2026.
Saudi dental statistics at a glance
| Figure | Value | Source and period |
|---|---|---|
| Dentists in Saudi Arabia | 33,751 | MOH Statistical Yearbook 2024, table 2-17, year 2024 |
| Dentists per 10,000 people | 9.5 (6.3 in 2019) | MOH yearbook 2024, table 1-8 |
| Private-sector dentists | 20,236 (60.0%) | MOH yearbook 2024, table 2-17; share is a Khaleej SEO calculation |
| Ministry of Health dentists | 9,331 | MOH yearbook 2024, table 2-17 |
| Other government sectors | 4,184 | MOH yearbook 2024, table 2-17 |
| Saudi dentists | 19,598 (58.1%; 35.3% in 2017) | MOH yearbook 2024, tables 2-17 and 2-18 |
| Women dentists | 15,127 (44.8%) | MOH yearbook 2024, table 2-18; share is a Khaleej SEO calculation |
| Dentists in the Riyadh region | 12,631 (37.4% of the total) | MOH yearbook 2024, table 2-27; share is a Khaleej SEO calculation |
| Ministry of Health dental centres | 44 | MOH yearbook 2024, table 2-4 |
How many dentists are there in Saudi Arabia?
The MOH yearbook reprints the last eight years of its dental workforce series in table 2-17. On the same counting basis, the number of dentists grew from 15,699 in 2017 to 25,970 in 2023, an increase of 65.4%. The 2024 figure of 33,751 comes from a new source: the yearbook notes that from 2024 its workforce data comes from the Saudi Commission for Health Specialties (SCFHS). Part of the jump from 2023 to 2024 therefore reflects the change of source, so read it as a new baseline, not as one year of growth.
| Year | Dentists | Ministry of Health | Other government | Private sector | Private share | Saudi share | Per 10,000 people |
|---|---|---|---|---|---|---|---|
| 2017 | 15,699 | 3,996 | 1,283 | 10,420 | 66.4% | 35.3% | |
| 2018 | 16,752 | 4,137 | 1,431 | 11,184 | 66.8% | 38.2% | |
| 2019 | 18,811 | 4,843 | 1,683 | 12,285 | 65.3% | 40.4% | 6.3 |
| 2020 | 19,622 | 5,815 | 1,768 | 12,039 | 61.4% | 49.6% | 6.2 |
| 2021 | 22,739 | 6,810 | 1,998 | 13,931 | 61.3% | 53.3% | 7.4 |
| 2022 | 23,897 | 7,153 | 1,853 | 14,891 | 62.3% | 53.5% | 7.4 |
| 2023 | 25,970 | 7,056 | 2,238 | 16,676 | 64.2% | 53.8% | 7.7 |
| 2024 (new source) | 33,751 | 9,331 | 4,184 | 20,236 | 60.0% | 58.1% | 9.5 |
Private share is a Khaleej SEO calculation (private-sector dentists divided by all dentists). The Saudi share and the density per 10,000 people are printed in the yearbook (tables 2-17 and 1-8).
Download the national and regional tables as CSV: dentists by region and sector, Saudi and non-Saudi, population and our per-10,000 ratios for 2024, plus the national series from 2017.
Where dentists work: a private-sector profession
Six in ten Saudi dentists work in the private sector, and that sector is where the profession’s nationality mix differs most. In 2024, 92.4% of Ministry of Health dentists were Saudi (8,625 of 9,331), against 36.5% in the private sector (7,387 of 20,236). The private-sector share has risen from 11.7% in 2017, so Saudi dentists are moving into private practice, but non-Saudi dentists still make up most of it.
Women are 44.8% of the profession: 15,127 of 33,751 dentists in 2024, and 9,145 of the 20,236 in the private sector.
Dentists by region: where clinics compete hardest
For a clinic owner, the useful number is not the national total but how many private-sector dentists compete for the same residents. We divided each region’s 2024 dentist count by its population in the 2022 census, the latest regional population the yearbook prints.
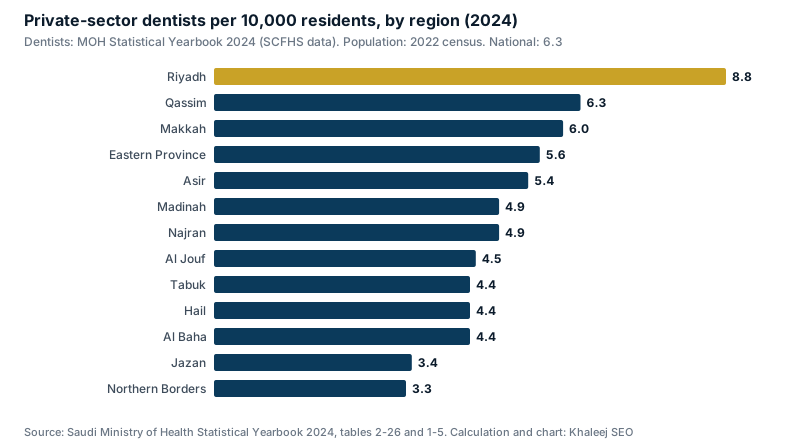
| Region | Dentists 2024 | Private sector | Share of KSA dentists | Share of KSA population | Dentists per 10,000 | Private dentists per 10,000 |
|---|---|---|---|---|---|---|
| Riyadh | 12,631 | 7,579 | 37.4% | 26.7% | 14.7 | 8.8 |
| Qassim | 1,477 | 836 | 4.4% | 4.2% | 11.1 | 6.3 |
| Makkah | 7,579 | 4,814 | 22.5% | 24.9% | 9.4 | 6.0 |
| Eastern Province | 4,248 | 2,856 | 12.6% | 15.9% | 8.3 | 5.6 |
| Asir | 1,952 | 1,084 | 5.8% | 6.3% | 9.6 | 5.4 |
| Madinah | 1,800 | 1,048 | 5.3% | 6.6% | 8.4 | 4.9 |
| Najran | 602 | 289 | 1.8% | 1.8% | 10.2 | 4.9 |
| Al Jouf | 526 | 268 | 1.6% | 1.9% | 8.8 | 4.5 |
| Tabuk | 628 | 392 | 1.9% | 2.8% | 7.1 | 4.4 |
| Hail | 648 | 325 | 1.9% | 2.3% | 8.7 | 4.4 |
| Al Baha | 399 | 148 | 1.2% | 1.1% | 11.8 | 4.4 |
| Jazan | 983 | 474 | 2.9% | 4.4% | 7.0 | 3.4 |
| Northern Borders | 278 | 123 | 0.8% | 1.2% | 7.4 | 3.3 |
| Saudi Arabia | 33,751 | 20,236 | 100% | 100% | 10.5 | 6.3 |
Shares and ratios are Khaleej SEO calculations. The yearbook reports dentists by Ministry of Health branch; we added the branches into the 13 administrative regions (Makkah = Holy Capital, Jeddah, Taif and Qunfudah; Eastern Province = Eastern, Al Ahsa and Hafr Al Batin; Asir = Asir and Bishah; Al Jouf = Al Jouf and Qurayyat). The regions add up exactly to the national 33,751.
Three findings:
- Riyadh is the most crowded private dental market. The region has 8.8 private-sector dentists per 10,000 residents, about 2.7 times the 3.3 of the Northern Borders, and 37.5% of all private-sector dentists in the Kingdom work there.
- Jeddah is a market of its own. The Jeddah health branch alone counts 4,837 dentists, 3,224 of them in the private sector, more than the whole Eastern Province’s private sector.
- High total density does not always mean private competition. Al Baha has 11.8 dentists per 10,000 residents, the second highest ratio, but only 37.1% of them are in the private sector, so its private density is 4.4, below the national 6.3.
Read the ratios as a comparison between regions, not as exact densities. Our national ratio on this basis is 10.5, higher than the MOH’s printed 9.5, because the population grew between the 2022 census and 2024: the General Authority for Statistics estimated 35.3 million people in mid 2024.
How many dental clinics are there in Saudi Arabia?
The MOH yearbook does not publish a national count of private dental practices. For 2024 it lists 44 Ministry of Health dental centres (table 2-4) and only 14 single-doctor private dental clinics (table 2-16), a narrow licence category. Most private dentists work in medical complexes: the yearbook counts 3,607 private medical complexes in 2024 (table 2-14, 1,171 of them in the Riyadh branch), but across all specialties, so it does not say how many offer dentistry. Any single “number of dental clinics in Saudi Arabia” you see quoted therefore comes from somewhere other than the MOH yearbook, and is worth checking at its source.
Where sources disagree
- Saudi and non-Saudi dentists by sector. A study published in PLOS One on 29 April 2026, based on the 2023 yearbook, describes Ministry of Health dentists as mostly non-Saudi and private-sector dentists as mostly Saudi. The yearbook tables print the opposite. Table 2-18 gives head counts for 2024: 8,625 Saudi and 706 non-Saudi dentists at the Ministry of Health, 7,387 Saudi and 12,849 non-Saudi in the private sector. For 2023, applying table 2-17’s printed Saudi percentages to each sector reproduces the national Saudi share of 53.8%; reversing them does not. We follow the yearbook as printed.
- The 2019 total. The same study gives 18,813 dentists for 2019; both the 2023 and the 2024 yearbooks print 18,811, which we use. Its other headline figures (25,970 dentists in 2023; 6.3 to 7.7 per 10,000 between 2019 and 2023) match the yearbook.
- 2023 versus 2024. The change of workforce source to the SCFHS in 2024 means the 2023 and 2024 totals are not a like-for-like series. Compare 2017 to 2023, or start a new series from 2024.
What this means for dental clinics
- In Riyadh and Jeddah, visibility decides who gets the patient. With the most private-sector dentists per resident, a clinic in these cities competes with many nearby practices on every search. Being in the map results for the treatment and the district matters more than anywhere else, which is what our dental clinic SEO work focuses on. For the Riyadh specifics, see our SEO agency in Riyadh page and our SEO services in Saudi Arabia. Our guide on how to get more dental patients in Riyadh and Jeddah sets these dentist counts against monthly search demand in both cities.
- A complete Business Profile for every branch is the baseline. Our guide to Google Business Profile for dental clinics covers categories, treatments as services, dentist profiles and reviews within Google’s rules.
- Treatment pages answer the searches patients make. Patients search for the treatment, not the clinic: implants, aligners, whitening, in Arabic and in English. Our dental clinic SEO guide for Saudi Arabia explains how patients choose, and our Arabic keyword research guide shows how to find the words they type.
- Smaller regions have fewer private competitors. In regions such as Jazan and the Northern Borders, a clinic with a well-built site and profile faces fewer rivals online.
To see how your clinic shows up in local search, request a free SEO audit.
Methodology and sources
- Dental workforce: Saudi Ministry of Health, Statistical Yearbook 2024 (Excel edition, file dated 20 October 2025, downloaded from the MOH statistics page on 6 October 2026). Tables used: 1-8 (health resources per 10,000 population, 2019 to 2024), 2-17 (health manpower by sector, 2017 to 2024, with Saudi %), 2-18 (manpower by category, sex and nationality, 2024), 2-24 to 2-27 (dentists by Ministry of Health branch for the MOH, other government sectors, private sector and all sectors, 2024) 2-4 (MOH health facilities by cluster, 2024), 2-14 (private sector facilities, 2024) and 2-16 (single-doctor private clinics by speciality, 2024). The 2023 yearbook (file dated 15 May 2025) was used to confirm the 2017 to 2023 series.
- Population by region: MOH yearbook 2024, table 1-5, 2022 census column, source General Authority for Statistics. National mid-2024 estimate of 35.3 million from the General Authority for Statistics publication “Population Estimates 2024”.
- Our calculations: private and Saudi shares from the printed counts; regional totals by adding Ministry of Health branches into administrative regions; dentists and private-sector dentists per 10,000 residents using the 2022 census population. All are labelled as Khaleej SEO calculations.
- Study cited for comparison: Kattan W., “Regional inequality in the distribution of dentists in Saudi Arabia by sector and nationality: a 2023 national analysis under Vision 2030”, PLOS One, 29 April 2026, doi 10.1371/journal.pone.0348204.
- Not included: counts of private dental clinics and dentists per specialty, because we found no official published figure we could open and check.
How to cite this page
Cite the Saudi Ministry of Health Statistical Yearbook as the source of each figure. For the regional calculations, the chart or the compilation, please credit “Khaleej SEO analysis of Ministry of Health data” and link to this page. The chart may be reused with that credit.
Updates
- 6 October 2026: first published, with the MOH Statistical Yearbook 2024 (data year 2024). We update this page when the MOH publishes its next yearbook.
Arabic and English SEO specialists for e-commerce stores, dental clinics and travel companies. Our team has led SEO for some of the largest e-commerce brands in the Gulf, across 7 MENA markets.