Saudi businesses online: only 35.1% have a website, 66.3% use social media and 33.5% sell or display goods online
GASTAT's 2025 and 2024 establishment surveys side by side: websites, social media, advertising, online selling and AI use across 18 activities, the gap between social media and websites, and what the sector numbers do not prove.
 The Khaleej SEO team
Published · Updated · 10 min read
Key finding: 35.1% of Saudi establishments had a website in 2025, up from 32.1% in 2024, while 66.3% used social media and 52.3% advertised there (GASTAT). Social media use is higher than website ownership in all 18 activities, by 31.2 points overall and by 52.9 points in arts and entertainment. Businesses also buy online more than they sell: 47.6% against 33.5% in 2025, in all 18 activities.
This page reads the General Authority for Statistics (GASTAT) survey of how establishments use information and communication technology, for 2025 and 2024. We went to the Excel publication tables behind the one-page bulletins, which carry 22 indicators for 18 economic activities, and compared the two years. The original parts are the gap between social media and websites, the gap between buying and selling online, the 2024 to 2025 changes by activity, and a test of whether any of it lines up with business closures and growth. It mostly does not.
Saudi businesses online at a glance
The table lists the 13 indicators we use, from the most common to the least common in 2025. An establishment is an economic unit with a legal entity that holds a commercial registration, and each figure is a share of establishments.
| Share of establishments that | 2024 | 2025 | Change (pts) |
|---|---|---|---|
| Have internet access | 98.0% | 98.1% | +0.1 |
| Have a business email address | 95.0% | 95.3% | +0.3 |
| Use e-government services | 92.0% | 93.2% | +1.2 |
| Use the internet for electronic banking | 76.3% | 79.1% | +2.8 |
| Use social media | 63.0% | 66.3% | +3.3 |
| Use the internet for advertising | 52.2% | 57.8% | +5.6 |
| Advertise their products on social media | 49.0% | 52.3% | +3.3 |
| Use cloud computing | 46.8% | 51.3% | +4.5 |
| Use the internet to buy goods and services | 46.8% | 47.6% | +0.8 |
| Use the internet for customer service | 42.2% | 44.7% | +2.5 |
| Have a website | 32.1% | 35.1% | +3.0 |
| Use the internet to sell or display goods and services | 29.0% | 33.5% | +4.5 |
| Use artificial intelligence technologies | 27.6% | 33.1% | +5.5 |
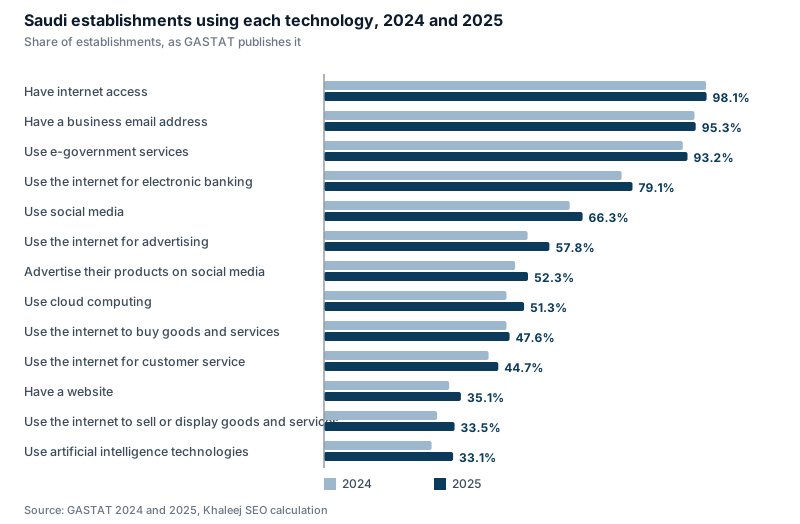
- Every one of the 13 indicators rose. The slow ones are already near the ceiling: internet access 98.1%, business email 95.3% and e-government 93.2%.
- AI grew fastest in relative terms (+19.9%, from 27.6% to 33.1%), then online selling (+15.5%) and advertising on the internet (+10.7%). The AI figures are covered in our AI adoption statistics page.
- Websites rose 3.0 points and social media 3.3 points, so the gap between them did not close: 30.9 points in 2024 and 31.2 in 2025.
- What separates businesses is no longer a connection. It is what they do with it, and the next sections look at the part that matters for search: who has a website, who sells and who advertises.
Who has a website: 18 activities
GASTAT’s tables give the share of establishments with a website for each activity. The table is sorted by the 2025 share.
| Activity | Website 2025 | 2024 | Change (pts) |
|---|---|---|---|
| Finance and insurance | 65.3% | 60.3% | +5.0 |
| Education | 57.9% | 56.7% | +1.2 |
| Mining and quarrying | 56.2% | 55.2% | +1.0 |
| Information and communication | 55.9% | 53.0% | +2.9 |
| Electricity, gas supply | 50.5% | 48.5% | +2.0 |
| Human health and social work | 47.6% | 43.8% | +3.8 |
| Transportation and storage | 42.9% | 39.8% | +3.1 |
| Professional activities | 40.5% | 36.7% | +3.8 |
| Agriculture and fishing | 37.7% | 37.6% | +0.1 |
| Arts, entertainment and recreation | 35.5% | 31.2% | +4.3 |
| Accommodation and food service | 35.2% | 32.1% | +3.1 |
| Real estate activities | 35.1% | 31.5% | +3.6 |
| Wholesale and retail trade | 34.7% | 31.2% | +3.5 |
| Construction | 34.6% | 32.8% | +1.8 |
| Manufacturing | 33.5% | 31.5% | +2.0 |
| Administrative and support service | 33.3% | 28.3% | +5.0 |
| Water supply; sewerage activities | 27.5% | 24.4% | +3.1 |
| Other service | 23.3% | 19.4% | +3.9 |
| All activities | 35.1% | 32.1% | +3.0 |
- Finance and insurance (65.3%), education (57.9%), mining and quarrying (56.2%) and information and communication (55.9%) lead. 13 of the 18 activities are below 50% and 10 are below 40%. Other services is lowest at 23.3%.
- Websites rose in all 18 activities. The biggest rises were finance and insurance (+5.0 points) and administrative and support services (+5.0); the smallest was agriculture and fishing (+0.1).
- Wholesale and retail trade: 34.7% (from 31.2%), so 65.3% of retail and wholesale establishments had no website.
- Human health: 47.6% (from 43.8%), so 52.4% of health and social work establishments had none.
- Accommodation and food service: 35.2%, so 64.8% had none.
Social media first, website second
In every one of the 18 activities more establishments use social media than have a website. The table gives the gap in points, widest first.
| Activity | Social media | Website | Gap (pts) |
|---|---|---|---|
| Arts, entertainment and recreation | 88.4% | 35.5% | 52.9 |
| Human health and social work | 90.1% | 47.6% | 42.5 |
| Administrative and support service | 72.9% | 33.3% | 39.6 |
| Professional activities | 79.9% | 40.5% | 39.4 |
| Other service | 61.6% | 23.3% | 38.3 |
| Accommodation and food service | 71.5% | 35.2% | 36.3 |
| Education | 90.2% | 57.9% | 32.3 |
| Real estate activities | 67.2% | 35.1% | 32.1 |
| Wholesale and retail trade | 64.9% | 34.7% | 30.2 |
| Water supply; sewerage activities | 57.5% | 27.5% | 30.0 |
| Construction | 63.9% | 34.6% | 29.3 |
| Manufacturing | 61.7% | 33.5% | 28.2 |
| Information and communication | 81.3% | 55.9% | 25.4 |
| Agriculture and fishing | 62.9% | 37.7% | 25.2 |
| Transportation and storage | 61.0% | 42.9% | 18.1 |
| Electricity, gas supply | 67.4% | 50.5% | 16.9 |
| Mining and quarrying | 65.6% | 56.2% | 9.4 |
| Finance and insurance | 72.3% | 65.3% | 7.0 |
| All activities | 66.3% | 35.1% | 31.2 |
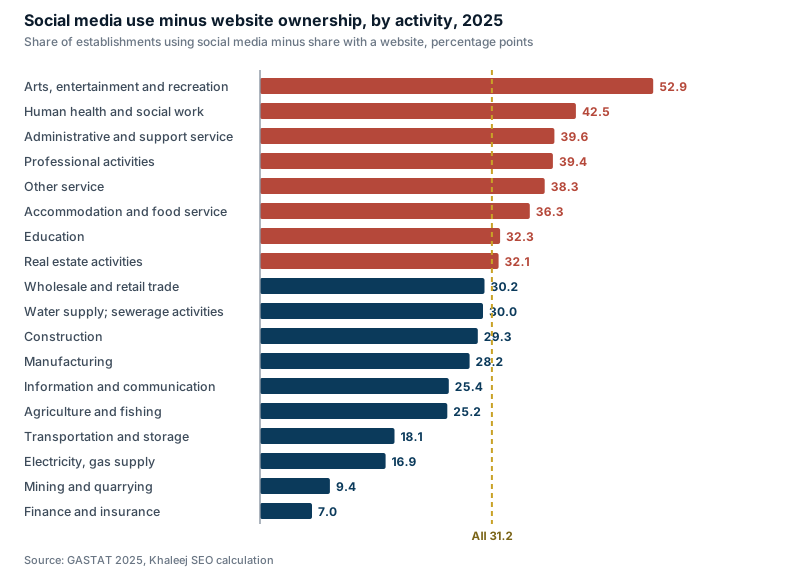
- Arts and entertainment (52.9 points) and human health (42.5) have the widest gaps. Health is also one of the two most social activities: 90.1% use social media and 78.9% advertise there, while 47.6% have a website.
- Finance and insurance (7.0 points) has the narrowest gap: 65.3% have a website against 72.3% on social media.
- The overall gap did not close. It narrowed in 10 activities and widened in 8, including retail (29.9 points in 2024, 30.2 in 2025).
The four activities that matter most for stores, clinics, hotels and travel companies, side by side:
| Activity | Website | Social media | Ads on social |
|---|---|---|---|
| Wholesale and retail trade | 34.7% | 64.9% | 51.7% |
| Human health and social work | 47.6% | 90.1% | 78.9% |
| Accommodation and food service | 35.2% | 71.5% | 68.3% |
| Administrative and support service | 33.3% | 72.9% | 51.8% |
| All activities | 35.1% | 66.3% | 52.3% |
Administrative and support services is the section that contains travel agencies and tour operators, along with employment, security and cleaning companies, so the tables cannot isolate travel agencies.
Selling and advertising online
GASTAT asks whether an establishment uses the internet to sell or display goods and services. The table is sorted by the 2025 share.
| Activity | Sell or display online 2025 | 2024 | Change (pts) |
|---|---|---|---|
| Finance and insurance | 48.5% | 44.4% | +4.1 |
| Mining and quarrying | 42.0% | 35.3% | +6.7 |
| Information and communication | 39.8% | 31.9% | +7.9 |
| Accommodation and food service | 39.3% | 33.4% | +5.9 |
| Wholesale and retail trade | 37.0% | 33.9% | +3.1 |
| Education | 36.0% | 31.2% | +4.8 |
| Transportation and storage | 35.1% | 29.9% | +5.2 |
| Arts, entertainment and recreation | 33.8% | 29.0% | +4.8 |
| Water supply; sewerage activities | 33.7% | 28.2% | +5.5 |
| Professional activities | 33.5% | 28.6% | +4.9 |
| Human health and social work | 32.4% | 27.4% | +5.0 |
| Manufacturing | 31.7% | 32.5% | -0.8 |
| Construction | 31.4% | 25.3% | +6.1 |
| Electricity, gas supply | 28.8% | 23.5% | +5.3 |
| Administrative and support service | 28.1% | 22.5% | +5.6 |
| Agriculture and fishing | 27.7% | 27.4% | +0.3 |
| Real estate activities | 21.7% | 16.8% | +4.9 |
| Other service | 21.6% | 17.3% | +4.3 |
| All activities | 33.5% | 29.0% | +4.5 |
- 33.5% sell or display online, up 4.5 points. The share rose in 17 of 18 activities; manufacturing fell from 32.5% to 31.7%.
- Finance and insurance leads at 48.5%, and other services is lowest at 21.6%.
- In 3 activities more establishments sell or display online than have a website: wholesale and retail trade (37.0% against 34.7%), accommodation and food service (39.3% against 35.2%) and water supply. GASTAT’s definition counts an online store, a website or a page that the establishment uses to display its products, so a shop on a marketplace or a page on a social platform can count as selling online without counting as a website. The tables do not split these cases, so we cannot say how many there are.
- Advertising is mostly social. 57.8% use the internet for advertising and 52.3% advertise their products on social platforms. Education (82.9%) and human health (78.9%) are the highest, retail is at 51.7%.
- Digital delivery is a minority case: 28.0% of the establishments that received orders online delivered the sale digitally. GASTAT does not say how the other establishments delivered.
Buying online and selling online: the gap
GASTAT asks establishments two parallel questions: do they use the internet to purchase or order goods and services, and do they use it to sell or display them. We lined up the two answers for the 18 activities. The table shows 2025, sorted by the gap, buying minus selling; the 2024 values are in the CSV linked below.
| Activity | Buy online | Sell or display online | Gap (pts) |
|---|---|---|---|
| Electricity, gas supply | 58.7% | 28.8% | 29.9 |
| Information and communication | 64.6% | 39.8% | 24.8 |
| Arts, entertainment and recreation | 57.8% | 33.8% | 24.0 |
| Real estate activities | 43.0% | 21.7% | 21.3 |
| Agriculture and fishing | 48.6% | 27.7% | 20.9 |
| Education | 55.1% | 36.0% | 19.1 |
| Manufacturing | 50.6% | 31.7% | 18.9 |
| Human health and social work | 50.8% | 32.4% | 18.4 |
| Professional activities | 50.3% | 33.5% | 16.8 |
| Other service | 38.4% | 21.6% | 16.8 |
| Water supply; sewerage activities | 49.9% | 33.7% | 16.2 |
| Construction | 45.1% | 31.4% | 13.7 |
| Wholesale and retail trade | 50.3% | 37.0% | 13.3 |
| Administrative and support service | 41.2% | 28.1% | 13.1 |
| Transportation and storage | 48.1% | 35.1% | 13.0 |
| Mining and quarrying | 52.7% | 42.0% | 10.7 |
| Finance and insurance | 58.4% | 48.5% | 9.9 |
| Accommodation and food service | 46.7% | 39.3% | 7.4 |
| All activities | 47.6% | 33.5% | 14.1 |
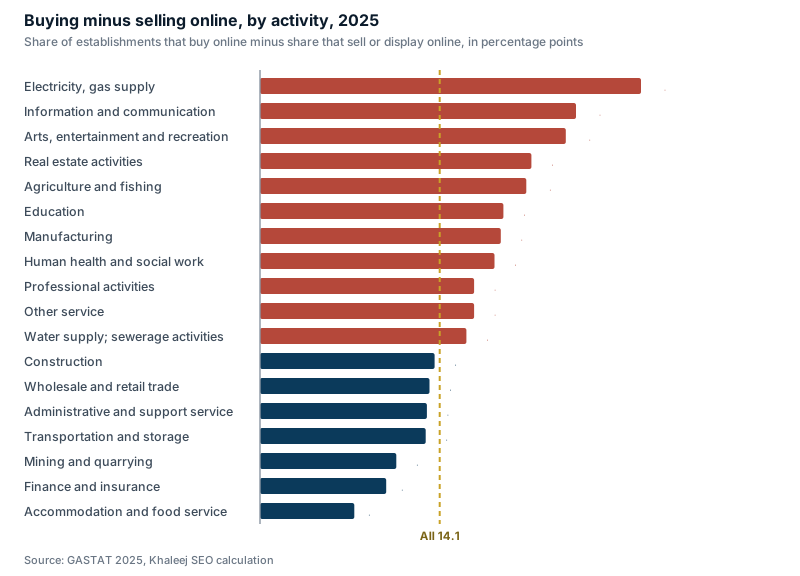
- Establishments buy online more than they sell: 47.6% against 33.5% in 2025, 1.4 times as many. In all 18 activities more establishments buy than sell, and the same was true in 2024.
- The gap is shrinking. It was 17.8 points in 2024 and is 14.1 in 2025, because selling rose 4.5 points while buying rose 0.8. It narrowed in 16 of 18 activities and widened in two: agriculture and fishing (18.3 to 20.9) and manufacturing (17.6 to 18.9).
- The widest gaps are in electricity and gas supply (29.9 points), information and communication (24.8) and arts, entertainment and recreation (24.0). Five activities have a gap of 20 points or more, while accommodation and food service (7.4), finance and insurance (9.9) and mining and quarrying (10.7) have the smallest.
- Activities that buy online also sell online. Across the 18 activities the buying and selling shares correlate +0.63 (Pearson) and +0.58 (Spearman), and +0.54 to +0.73 when one activity is dropped at a time. Website share lines up with buying (+0.73 and +0.74) at least as closely as with selling (+0.68 and +0.59).
- Websites do not explain the size of the gap. Gap and website share correlate at +0.05 (Pearson) and +0.08 (Spearman). This shows that the two habits go together, not why selling lags.
How this compares with shoppers
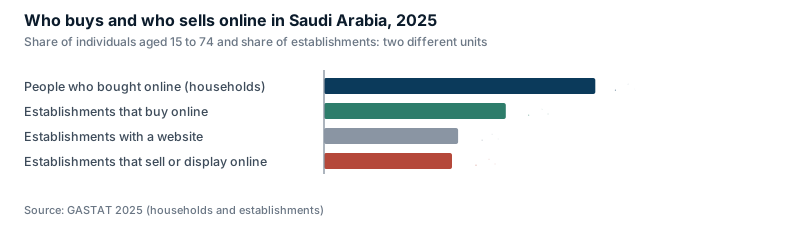
The household survey measures people, not establishments, so the two numbers cannot be added or turned into a market share, but they can be read side by side. In 2025, 71.0% of individuals aged 15 to 74 bought goods or services online and 33.5% of establishments sold or displayed online: 2.1 times as many, a gap of 37.5 points. The share of individuals reached 74.5% in 2026, and the full tables are in our Saudi online shopping statistics page. Wholesale and retail trade, the activity that contains retailers, has 50.3% of establishments buying online, 37.0% selling or displaying and 34.7% with a website.
Among shoppers in 2026, 96.1% used local stores and 68.2% used global stores, up from 44.6% in 2025. GASTAT does not ask why shoppers use global stores and the establishment survey does not measure selling across borders, so we do not join these two facts into a cause.
What the sector numbers do not show
Our Saudi SME statistics page holds GASTAT’s closed-enterprise rates, new-enterprise rates, revenue growth and operating surplus margins for 17 of these activities. We lined up six indicators from this survey (website, online selling, social media, social advertising, internet advertising and AI) against those four outcomes. That is 24 pairs, and the table shows the six strongest by Spearman correlation. The last column drops one activity at a time to see whether a single one drives the result.
| Pair (17 activities) | Pearson | Spearman | Pearson, dropping one |
|---|---|---|---|
| Website share and SME revenue growth 2019 to 2024 | -0.49 | -0.49 | -0.56 to -0.42 |
| Online selling share and operating surplus margin 2024 | +0.61 | +0.38 | +0.44 to +0.72 |
| AI share and SME revenue growth 2019 to 2024 | -0.33 | -0.37 | -0.42 to -0.24 |
| Social media share and new-enterprise rate 2024 | -0.38 | -0.36 | -0.45 to -0.29 |
| Website share and closed-enterprise rate 2024 | -0.45 | -0.35 | -0.63 to -0.23 |
| AI share and operating surplus margin 2024 | +0.29 | +0.35 | +0.09 to +0.51 |
- No pair reaches 0.5 on both Pearson and Spearman. With 17 activities and 24 pairs tested, a few moderate correlations would appear by chance alone.
- The strongest by Spearman is negative: activities with more websites grew SME revenue more slowly from 2019 to 2024 (-0.49 Pearson, -0.49 Spearman). A plausible reading is maturity, not harm: finance and education already had high website shares and grew 43.1% and 12.5%, while construction and arts grew 84.3% and 87.2% from lower website shares. The data cannot show this.
- Websites and closures lean the expected way but weakly (-0.45 Pearson, -0.35 Spearman). Activities with more websites closed a little less often, but the range when one activity is dropped is wide, and an activity average cannot say what a website does for one business.
- The digital indicators do line up with each other. Across the 18 activities the website share correlates +0.81 (Pearson) and +0.83 (Spearman) with the AI share, and +0.68 and +0.59 with the share that sells or displays online.
So do not quote this page as “websites reduce closures”. The honest summary is that the sector tables show where businesses are online, not what being online earns them.
How to read the figures
- Unit and sample. Establishments, not people or revenue. GASTAT’s 2025 sample was 47,804 establishments, and results are published for 18 first-level activities. The tables have no split by size or region.
- Bases differ. GASTAT states “out of the total establishments using the Internet” as the base for social media, e-government, buying, customer service and AI, and “out of the total responding establishments” for internet access. Its methodology lists the website indicator among those that draw on Ministry of Commerce records, and the tables print no base for it. Because 98.1% of establishments have internet access, the choice of base moves any figure on this page by at most about 1.3 points.
- Buying is not the mirror of selling. GASTAT’s table counts establishments that purchase or order goods and services online, which includes supplies, equipment and services bought from any seller in Saudi Arabia or abroad. A buyer in this survey is not looking for a local seller, so the gap is not unmet demand. The sell table prints no base, and as with the other indicators the choice of base moves a figure by at most about 1.3 points, while the smallest gap is 7.4 points.
- “Sell or display” is wide. GASTAT defines online buying and selling as the presence of an online store, website or page through which the establishment displays its products to customers. The definition does not mention online payment.
- Changes are in points. The tables carry no margin of error. We read changes of about a point as noise.
- Not measured here: Google Business Profile listings, search traffic, marketplace sales, online payments and revenue.
- Arabic wording. GASTAT’s 2025 bulletin was found in English only. The Arabic activity names and indicator titles come from the bilingual Excel tables.
What this means for businesses
This section is our analysis, not a source figure.
- Stores: a site you own is still the minority route. About one retail and wholesale establishment in three (34.7%) had a website in 2025, while 37.0% sold or displayed online, which points to marketplace and social storefronts. Both routes can sell, but a marketplace page builds the marketplace’s brand, while your own site is the place where the product pages, the reviews and the customer relationship are yours, and it keeps working if a platform changes its rules. See our e-commerce SEO service and the Saudi e-commerce statistics page.
- Clinics: nine in ten are on social media, about half have no website. With 90.1% on social media and 52.4% without a website, a clinic with an active Instagram account and no site can miss the patients who start with a search. GASTAT does not measure Google profiles, so we cannot say how many of these clinics have one. Start with our dental SEO service, the Google Business Profile guide for dental clinics and the Saudi dental statistics.
- Hotels, restaurants and travel: social advertising is strong, websites are not. In accommodation and food service 68.3% advertise on social platforms and 35.2% have a website. Travel agencies sit inside administrative and support services (33.3% with a website), where the tables cannot isolate them. Our travel SEO page covers direct bookings from search.
- Where your activity sits in the table decides how crowded the web is. Websites are held by about a third of establishments and rose 3.0 points in a year. In an activity near the bottom of the table a well-built site meets few site-owning rivals; in finance or education most competitors already have one. Check your row before you size the effort.
- Quote the unit, the base and the year. “35 percent of Saudi businesses have a website” should say whose figure it is and for which year, and should not be turned into a statement about consumers, revenue or traffic.
- You may be halfway there. 47.6% of establishments buy online, 33.5% sell or display there and 35.1% have a website. A business that already orders its supplies online has the card, delivery and trust routines of online commerce in place; the open question is whether customers can find what it sells. This is our reading, not a GASTAT finding.
For a plan built on your own data, a free SEO audit shows what Google sees today, and the SEO agency in Saudi Arabia page explains how we work with small and growing businesses. The consumer side of the same market is in our Saudi social media statistics, and the small business view in our small business SEO guide.
The shopper side of the same market, from GASTAT’s household survey, is in our Saudi online shopping statistics page.
Methodology and sources
- GASTAT, Establishments ICT Access and Usage Statistics 2025 and 2024: publication tables (Excel, 27 tables per year, Arabic and English), downloaded on 1 November 2026 from the links printed in GASTAT’s two English bulletins (PDF, also opened that day). We loaded the 22 single-indicator tables for both years, checked the total row of the tables against 15 national figures printed in the bulletins (8 for 2025 and 7 for 2024; all matched) and the AI and online-selling sector values for 2025 and the AI and e-government sector values for 2024 against the bulletin charts (all matched).
- GASTAT, Methodology and Quality Report for ICT Access and Usage Statistics for Establishments 2025 (updated 26 August 2026): definitions, bases, the sample of 47,804 establishments, the Ministry of Commerce records used for some indicators, and the note that the series began in 2023 and is comparable over time.
- Outcomes for the cross-check come from our Saudi SME statistics CSV files, built from GASTAT’s Business Demography Statistics 2024 and Small and Medium Establishments Statistics 2024.
- Buying and selling comparison (added 3 November 2026): tables 23 (purchase or order) and 21 (sell or display) of the same GASTAT publication tables. We read the total rows (47.6% and 33.5% for 2025, 46.8% and 29.0% for 2024) and checked five activities (wholesale and retail trade, accommodation and food service, real estate, arts and entertainment, other service) against the original cells for both years. The shopper figures come from the publication tables of GASTAT’s ICT Access and Usage Statistics for Households and Individuals 2026 and 2025, loaded for our online shopping page.
- Our calculations: changes in points and in relative terms, the gap between social media and website shares, and the correlations (Pearson and Spearman, with one activity dropped at a time). Values are rounded to the digits shown.
- Limits: survey estimates with no published margin of error; 2023 tables not found at GASTAT’s file link, so no three-year trend; activity averages, not businesses; the website row has no stated base; display counts as selling; no size or region split; correlations on 17 activities describe the activities and say nothing about cause.
Free downloads: saudi-business-ict-by-activity-2024-2025.csv holds 22 indicators for 18 activities and the total, 2024 and 2025. saudi-business-ict-national-2024-2025.csv holds the 13 national indicators with changes. saudi-business-social-vs-website-by-activity.csv holds the website and social media shares and the gap by activity. A fourth file added on 3 November 2026, saudi-business-buy-vs-sell-by-activity-2024-2025.csv, holds the buying, selling and website shares and the gaps by activity.
How to cite this page
Khaleej SEO, “Saudi businesses online: only 35.1% have a website, 66.3% use social media”, khaleejseo.com/blog/saudi-businesses-online-statistics/, updated 3 November 2026. Name GASTAT as the source of the underlying figures. The charts and the CSV files may be reused with this credit and a link.
Updates
- 1 November 2026: first published, with GASTAT’s 2025 and 2024 publication tables. We will add GASTAT’s next survey results when they appear on stats.gov.sa, and the 2023 tables if GASTAT links them.
- 3 November 2026: added the section on buying and selling online (table, chart, CSV and the comparison with shoppers), after finding that more establishments buy online than sell online in all 18 activities.
Licence: the compilation, calculations, charts and CSV files on this page are shared under CC BY 4.0: credit Khaleej SEO and link to this page. Source figures stay under their publisher's terms, so credit the source named next to each figure.
Arabic and English SEO specialists for e-commerce stores, dental clinics and travel companies. Our team has led SEO for some of the largest e-commerce brands in the Gulf, across 7 MENA markets.