Saudi e-commerce statistics 2026: key numbers and sources
Every key Saudi e-commerce figure from SAMA, GASTAT and CST in one place, with the source and date on each line, a monthly mada e-commerce series since January 2019 as a free CSV, and what the official numbers say that vendor market reports do not.
 The Khaleej SEO team
Published · Updated · 9 min read
Key figures: Saudi shoppers paid SAR 325.2 billion online with mada cards in 2025, up 64.7% on 2024, according to Saudi Central Bank (SAMA) data. The first half of 2026 alone reached SAR 199.8 billion, more than the whole of 2024, and July 2026 was the biggest month on record at SAR 37.6 billion. On the shopper side, 71.0% of people aged 15 to 74 buy online (GASTAT, 2025), and 93.1% of online shopping happens on local websites (CST).
This page collects the official Saudi e-commerce statistics in one place, each with its source and date, and adds our own analysis of SAMA’s monthly mada e-commerce series from January 2019 to July 2026. Compiled by the Khaleej SEO research team; every source below was opened on 3 October 2026.
Saudi e-commerce at a glance
| Figure | Value | Source and period |
|---|---|---|
| E-commerce paid with mada cards | SAR 325.2 billion | SAMA, full year 2025 |
| Growth on the year before | +64.7% (from SAR 197.4 billion) | SAMA, 2025 vs 2024 |
| mada e-commerce transactions | 1.77 billion | SAMA, 2025 |
| First half of 2026 | SAR 199.8 billion, +36.9% | SAMA, January to June 2026 vs 2025 |
| Record month | SAR 37.6 billion, 197.6 million transactions | SAMA, July 2026 |
| Growth in the latest month | +26.0% year on year | SAMA, July 2026 vs July 2025 |
| Adults who buy online | 71.0% (80.2% of Saudis) | GASTAT ICT survey, 2025, ages 15 to 74 |
| Online shopping on local websites | 93.1% | CST Saudi Internet Report 2024, announced 12 May 2025 |
| Electronic share of retail payments | 85% (79% in 2024) | SAMA via SPA, 2025, published 12 April 2026 |
| Internet use | 99.0% of individuals | GASTAT ICT survey, 2025, ages 15 to 74 |
For in-store card spending, contactless and phone payments, see our Saudi digital payments statistics.
mada e-commerce, month by month
SAMA publishes the value and number of e-commerce payments made with mada, the national debit card network, every month. SAMA’s own definition, as reported by the Saudi Press Agency: payments with mada cards on shopping websites, apps and e-wallets, not including credit cards. We use the full monthly series as republished by the KAPSARC Data Portal, which lists SAMA as the publisher, and checked it against SAMA figures quoted by the Saudi Press Agency: SAR 44.4 billion for the first quarter of 2024, SAR 69.3 billion for the first quarter of 2025 and SAR 27.4 billion for May 2025 all match.
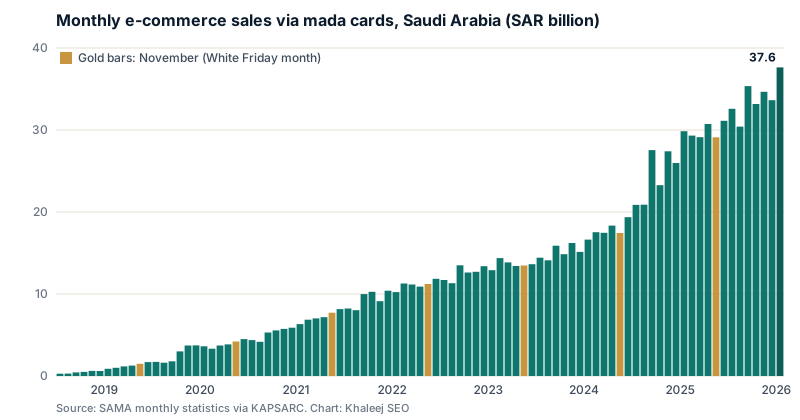
| Year | mada e-commerce sales | Growth | Transactions | Average payment |
|---|---|---|---|---|
| 2019 | SAR 10.3 billion | 38.1 million | SAR 268.8 | |
| 2020 | SAR 38.8 billion | +278.7% | 170.3 million | SAR 228.0 |
| 2021 | SAR 74.3 billion | +91.4% | 347.7 million | SAR 213.8 |
| 2022 | SAR 122.7 billion | +65.1% | 610.6 million | SAR 200.9 |
| 2023 | SAR 156.9 billion | +27.9% | 873.7 million | SAR 179.6 |
| 2024 | SAR 197.4 billion | +25.8% | 1,125.9 million | SAR 175.3 |
| 2025 | SAR 325.2 billion | +64.7% | 1,770.8 million | SAR 183.6 |
Download the monthly series as CSV: month, sales in SAR billion, transactions in millions, average payment and year-on-year growth, January 2019 to July 2026.
Three things stand out:
- 2025 broke the slowdown. Growth had eased to about 26% to 28% a year in 2023 and 2024. In 2025 it jumped back to 64.7%, and the first seven months of 2026 are still 35.1% above the same months of 2025.
- The value is now about 32 times its 2019 level, while the number of payments grew more than 46 times. People are paying online for more, smaller things.
- The average payment fell from SAR 268.8 in 2019 to SAR 175.3 in 2024, before edging up to SAR 183.6 in 2025. Online payment in Saudi Arabia is no longer reserved for big purchases; it is part of everyday spending.
White Friday no longer lifts mada online spending
The finding we did not expect: November, the White Friday month, used to be clearly stronger than October in this series. That gap has shrunk every year since 2019, and in 2024 and 2025 November came in below October.
| Year | October | November | November vs October | Per day |
|---|---|---|---|---|
| 2019 | SAR 1.27 billion | SAR 1.48 billion | +16.5% | +20.4% |
| 2020 | SAR 3.85 billion | SAR 4.21 billion | +9.4% | +13.0% |
| 2021 | SAR 7.17 billion | SAR 7.72 billion | +7.7% | +11.3% |
| 2022 | SAR 10.90 billion | SAR 11.22 billion | +3.0% | +6.4% |
| 2023 | SAR 13.42 billion | SAR 13.48 billion | +0.5% | +3.8% |
| 2024 | SAR 18.34 billion | SAR 17.44 billion | -4.9% | -1.7% |
| 2025 | SAR 30.74 billion | SAR 29.11 billion | -5.3% | -2.1% |
The per-day column corrects for October having 31 days and November 30. Even then, November has been weaker for two years in a row. December, not November, was the biggest month of the year in 6 of the 7 full years (August was the peak in 2023).
What this does and does not show: mada is a debit card network, so White Friday spending that moves to credit cards or to other payment methods would not appear here. The finding is that the mada online peak has moved away from November, not that White Friday sales have fallen. It matches what our analysis of SAMA’s weekly in-store card data found: in stores, White Friday week lifts clothing every year, while total spending rises in some years and falls in others. For how searches behave in the same weeks, see our White Friday statistics.
Who shops online in Saudi Arabia
From GASTAT’s ICT Access and Usage Statistics by Households and Individuals survey for 2025, covering people aged 15 to 74:
- 71.0% bought goods or services online; 80.2% of Saudis, with Saudi women (82.8%) ahead of Saudi men (77.6%).
- 57.2% of internet users go online to find information about goods or services.
- 98.4% use a mobile phone to go online, and 96.8% use the internet at least once a day.
What online shoppers bought (share of online shoppers, GASTAT 2025):
| Category | Share |
|---|---|
| Clothing, footwear and sports goods | 88.8% |
| Cosmetics | 40.2% |
| Food, groceries or tobacco | 38.5% |
| Household goods | 31.4% |
| Travel products | 20.0% |
| Tickets or reservations for entertainment | 19.4% |
| ICT services | 18.9% |
| Medicines | 16.9% |
| Computer equipment or parts | 15.0% |
And from the Communications, Space and Technology Commission (CST) Saudi Internet Report 2024, announced on 12 May 2025: 93.1% of online shopping happens on local websites. For a Saudi store, the competition is mostly other local stores, not global marketplaces. The 2025 edition of the CST report, released on 19 July 2026, shows 95.3% for local websites and 55.4% for international websites; the two add to more than 100%, so many shoppers use both. Our Saudi internet statistics cover the other 2025 CST figures.
Official figures vs market reports: why the numbers disagree
Search for the size of Saudi e-commerce and you will find research firm estimates that differ from each other, and from SAMA, by large margins. They are usually not wrong; they measure different things.
| Question | SAMA mada e-commerce | Typical research firm estimate |
|---|---|---|
| What is counted | mada debit card payments on websites, apps and e-wallets | Total online sales as the firm defines them |
| Credit cards, cash on delivery | Not included | Often included |
| Services, travel, business purchases | Included when paid by mada | Depends on the firm’s scope |
| Measured or modelled | Measured payment data | Usually modelled, often a forecast |
| Free to check | Yes, monthly | Often paywalled |
Two rules we follow, and suggest to anyone writing about the market: never compare a SAMA figure with a market report figure as if they measured the same thing, and always say which one you are quoting. The SAMA series is the strongest official measure of the trend, but it is a floor, not a total, because it leaves out other payment methods.
What this means for Saudi online stores
- Demand keeps moving online, and local stores win most of it. With 93.1% of online shopping on local websites, a Saudi store’s real rivals are visible on page one of Google for its own categories. That is where e-commerce SEO pays back.
- Clothing, cosmetics and groceries lead. These categories have the most online shoppers, and the most competition in search. Category pages written in Gulf Arabic, not translated copy, are the difference; see our Arabic SEO service.
- Do not plan only around November. December has been the bigger mada online month in most years. Build and index seasonal category pages well before both.
- Read social numbers carefully. GASTAT says 96.2% of internet users take part in social media, while the headline of 38.6 million “users” equals TikTok’s advertising reach; see our Saudi social media statistics before sizing a social budget.
- Make sure Google can see the store at all. Growth means nothing to a store that is not indexed; our store not showing on Google checklist covers the free checks.
Stores on Salla can start with our Salla SEO services, and any store can request a free SEO audit to see where it stands against its category.
Methodology and sources
- mada e-commerce: SAMA monthly statistics, series “E-Commerce Transactions Using Mada Cards” (sales in thousand riyals and number of transactions), monthly, quarterly and annual values, as republished on the KAPSARC Data Portal (dataset “Points of Sale Transactions and E-Commerce Transactions (Mada Cards)”, publisher Saudi Central Bank, last modified 15 September 2026). Downloaded 3 October 2026. Monthly values from January 2019 to July 2026; annual totals from SAMA’s annual rows. Growth rates, per-day values and average payment (sales divided by transactions) are our own calculations.
- Cross-check: Saudi Press Agency releases of 24 July 2024 (first quarter 2024, January and May 2024) and 3 July 2025 (first quarter 2025, January, April and May 2025) match the series.
- Shoppers: GASTAT, ICT Access and Usage Statistics by Households and Individuals 2025, publication PDF, opened 3 October 2026.
- Local websites: CST announcement of the Saudi Internet Report 2024, dated 12 May 2025, opened 3 October 2026.
- Electronic payments share: Saudi Press Agency, “SAMA: E-Payments Account for 85% of Total Retail Payments in 2025”, 12 April 2026.
- Vendor market size estimates are deliberately not quoted as facts on this page.
How to cite this page
Cite the original source named next to each figure, for example “according to the Saudi Central Bank (SAMA)”. For the compilation, the chart or the November analysis, please credit “Khaleej SEO analysis of SAMA data” and link to this page.
Updates
- 21 October 2026: added the CST Saudi Internet 2025 figures for local and international websites.
- 3 October 2026: first published, with SAMA monthly data to July 2026. We update this page when SAMA’s next monthly figures are republished.
Arabic and English SEO specialists for e-commerce stores, dental clinics and travel companies. Our team has led SEO for some of the largest e-commerce brands in the Gulf, across 7 MENA markets.