Saudi card spending by city: Riyadh takes 34.4% and Jeddah 13.8%, and Riyadh's share has risen every year since 2022
SAMA's weekly point of sale data grouped by city: a ranking of 60 cities, five years of Riyadh and Jeddah shares, the average payment in each city, and the weeks when Makkah, Abha and Taif gain share.
 The Khaleej SEO team
Published · Updated · 9 min read
Key finding: Riyadh takes 34.4% of Saudi card spending at points of sale and Jeddah 13.8%, together 48.2% of SAR 547.5 billion in 39 weeks. Riyadh’s share rose every year from 2022 (30.9%) to 2025 (34.6%) while Jeddah’s fell from 16.1% to 14.0%.
This page ranks 60 cities from SAMA’s weekly point of sale report and reads five years of it for ten cities. Weekly news items give one week at a time; here the question is how the split between cities changes over years and seasons. The card data counts payments in shops, restaurants and other points of sale, not online orders, and the method section says what it can and cannot show.
Saudi card spending by city at a glance
| Figure | Value | Source and period |
|---|---|---|
| Riyadh, share of card spending at points of sale | 34.4% (SAR 188.3 billion of SAR 547.5 billion) | SAMA via KAPSARC, 29 June 2025 to 22 March 2026 |
| Jeddah | 13.8% (SAR 75.8 billion) | Same period |
| Riyadh and Jeddah together | 48.2% | Same period |
| Top 5 and top 10 cities | 61.5% and 73.0% of all spending, including the “Others” group | Same period, our calculation |
| Cities with a share of 1% or more | 17 of 60 | Same period, our calculation |
| Riyadh’s share by year | 31.0% (2021), 30.9%, 32.6%, 33.7%, 34.6% (2025) | SAMA via KAPSARC, our calculation |
| Jeddah’s share by year | 16.1% (2021) to 14.0% (2025), lower in each year | SAMA via KAPSARC, our calculation |
| Fastest growth in spending, 2021 to 2025 | Makkah 87.0%, Riyadh 66.7%, against 49.3% for Saudi Arabia | SAMA via KAPSARC, our calculation |
| Average card payment, Saudi Arabia | SAR 61.2 in 2025, from SAR 91.4 in 2021 | SAMA via KAPSARC, our calculation |
| Makkah in Ramadan weeks | 128 to 154 where 100 is its pre-Ramadan share | Five Ramadans, 2022 to 2026 |
| Abha in July | 138 to 148 where 100 is its yearly share | Five years, 2021 to 2025 |
The 60 cities ranked
SAMA lists 60 cities in its detailed weekly table and groups the rest as “Others”. The table shows the top 20 for the 39 weeks from 29 June 2025 to 22 March 2026, when point of sale spending across all cities was SAR 547.5 billion. The average payment is spending divided by the number of transactions.
| City | SAR billion | Share | Avg payment, SAR |
|---|---|---|---|
| 1. Riyadh | 188.3 | 34.4% | 65.6 |
| 2. Jeddah | 75.8 | 13.8% | 71.8 |
| 3. Dammam | 26.5 | 4.8% | 73.3 |
| 4. Makkah | 23.8 | 4.3% | 64.9 |
| 5. Madinah | 22.3 | 4.1% | 61.7 |
| 6. Khobar | 15.4 | 2.8% | 83.1 |
| 7. Buraidah | 13.5 | 2.5% | 66.4 |
| 8. Taif | 12.7 | 2.3% | 52.0 |
| 9. Khamis Mushait | 11.4 | 2.1% | 67.6 |
| 10. Tabuk | 9.8 | 1.8% | 54.7 |
| 11. Hail | 8.7 | 1.6% | 56.1 |
| 12. Abha | 6.9 | 1.3% | 53.6 |
| 13. Jazan | 6.5 | 1.2% | 53.5 |
| 14. Najran | 6.1 | 1.1% | 54.9 |
| 15. Jubail | 5.8 | 1.1% | 59.1 |
| 16. Hofuf | 5.6 | 1.0% | 63.8 |
| 17. Hafar Al Batin | 5.6 | 1.0% | 52.9 |
| 18. Al Kharj | 4.8 | 0.9% | 51.8 |
| 19. Yanbu | 4.2 | 0.8% | 50.8 |
| 20. Qatif | 3.6 | 0.7% | 61.6 |
The CSV holds all 60 cities and the “Others” row. Five points from the full ranking:
- Two cities take almost half. Riyadh and Jeddah together are 48.2% of spending. The next eight cities in the table add about a quarter more, so the top 10 hold 73.0% and the top 5 hold 61.5%.
- Many cities, thin shares. 17 cities reach a share of 1% or more and together hold 81.2%. Cities ranked 21 to 60 add 9.7% between them, and the “Others” group 6.8%.
- Eastern Province spending is spread over many rows. Dammam (4.8%), Khobar, Jubail, Hofuf, Qatif and Dhahran are separate rows, so read them together before you compare the region with Jeddah.
- Makkah and Madinah sit just below Dammam. Makkah holds 4.3% and Madinah 4.1%, well below Jeddah.
- Taif is the eighth largest city (2.3%), ahead of Tabuk and Hail, with a low average payment (SAR 52.0).
Riyadh’s share keeps rising
For the ten cities that SAMA has reported since May 2020 we can follow the share of each city in every calendar year. Each year is made of the weeks that start in it: 52 weeks, except 2023 with 53. The table gives each city’s share in % of all Saudi point of sale spending.
| City | 2021 | 2022 | 2023 | 2024 | 2025 |
|---|---|---|---|---|---|
| Riyadh | 31.0 | 30.9 | 32.6 | 33.7 | 34.6 |
| Jeddah | 16.1 | 15.5 | 14.3 | 14.0 | 14.0 |
| Makkah | 3.4 | 3.9 | 4.1 | 4.2 | 4.2 |
| Madinah | 3.7 | 3.8 | 3.9 | 4.0 | 4.0 |
| Dammam | 5.3 | 5.4 | 5.1 | 4.9 | 4.9 |
| Khobar | 3.4 | 3.1 | 2.9 | 2.8 | 2.9 |
| Buraidah | 2.5 | 2.5 | 2.4 | 2.3 | 2.4 |
| Hail | 1.7 | 1.7 | 1.6 | 1.6 | 1.6 |
| Abha | 1.5 | 1.5 | 1.4 | 1.3 | 1.3 |
| Tabuk | 1.8 | 1.8 | 1.8 | 1.9 | 1.9 |
| Other cities | 29.6 | 30.0 | 29.8 | 29.3 | 28.3 |
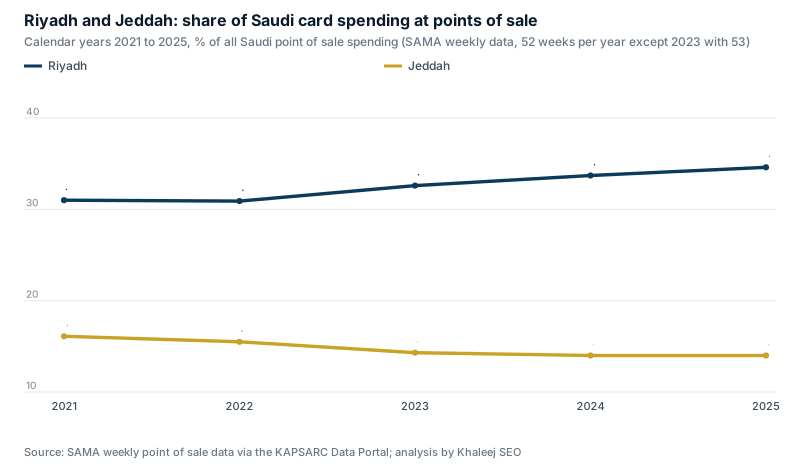
Riyadh gained 3.6 points between 2021 and 2025 and Jeddah lost 2.1 points. Together they went from 47.1% to 48.6%. Jeddah’s share fell in each year, including the last step, which shows only at two decimals (14.03% in 2024 and 13.98% in 2025). The share held by all other cities combined fell from 29.6% to 28.3%. Jeddah’s value still grew, as the next table shows.
Which cities grew fastest
The table gives spending per calendar year in SAR billion and the change from 2021 to 2025.
| City | 2021, SAR billion | 2025, SAR billion | Change |
|---|---|---|---|
| Makkah | 15.9 | 29.7 | +87.0% |
| Riyadh | 146.5 | 244.2 | +66.7% |
| Madinah | 17.5 | 28.2 | +60.9% |
| Tabuk | 8.6 | 13.1 | +52.8% |
| Buraidah | 11.9 | 17.1 | +43.8% |
| Hail | 7.9 | 11.2 | +41.7% |
| Dammam | 25.2 | 34.7 | +37.7% |
| Jeddah | 75.9 | 98.6 | +29.9% |
| Khobar | 16.0 | 20.2 | +26.2% |
| Abha | 7.2 | 9.0 | +25.5% |
| All other cities | 139.9 | 199.4 | +42.5% |
| Saudi Arabia, all cities | 472.4 | 705.4 | +49.3% |
Makkah, Riyadh, Madinah and Tabuk grew faster than Saudi Arabia (49.3%); the other six cities grew more slowly, from Abha (25.5%) to Buraidah (43.8%). Read the Makkah and Madinah figures with care: 2021 is the lowest base in their series (Makkah 3.4%, Madinah 3.7%), and we did not adjust for it. From 2022 their shares are steadier (Makkah 3.9% to 4.2%, Madinah 3.8% to 4.0%). We can show where spending moved; the data does not say why, and we do not name a cause.
The average payment fell in all ten cities
The average payment is spending divided by the number of transactions. For Saudi Arabia it was SAR 91.4 in 2021 and SAR 61.2 in 2025, while the number of transactions grew 123.1%. Our post on Saudi digital payments reports SAR 61.24 for 2025 on SAMA’s monthly national series, which matches the weekly figure and is a useful check on it.
| City | 2021, SAR | 2025, SAR | Change |
|---|---|---|---|
| Khobar | 121.1 | 83.9 | -30.7% |
| Dammam | 103.8 | 74.1 | -28.6% |
| Jeddah | 103.6 | 72.2 | -30.3% |
| Riyadh | 103.6 | 66.2 | -36.1% |
| Buraidah | 86.9 | 65.5 | -24.6% |
| Makkah | 76.0 | 63.5 | -16.4% |
| Madinah | 75.6 | 60.4 | -20.1% |
| Hail | 82.2 | 55.6 | -32.4% |
| Tabuk | 78.2 | 54.7 | -30.1% |
| Abha | 81.9 | 53.1 | -35.2% |
| Saudi Arabia, all cities | 91.4 | 61.2 | -33.1% |
Riyadh’s average payment fell 36.1% and Abha’s 35.2%, the most in the table, and Makkah’s 16.4% the least. In the 39 weeks to 22 March 2026, among cities with at least 0.4% of spending, the highest averages were Khobar (SAR 83.1), Dammam (SAR 73.3) and Jeddah (SAR 71.8) and the lowest was Muhayil (SAR 45.5); Riyadh was at SAR 65.6 and the “Others” group at SAR 42.6. Across the 60 cities 41 had an average of SAR 55 or less. The average mixes what people buy with how they pay, so a lower figure can mean smaller baskets, more frequent payments or a different mix of shops, and the data cannot separate them.
Seasons move spending between cities
Spending does not keep the same city split all year. We measured two calendar effects with the same index: a city’s share of all Saudi point of sale spending in a set of weeks, divided by its share in a baseline, times 100. A value of 100 means no change in share.
Ramadan: Makkah gains, Riyadh and Khobar give up share
We compared the weeks from the first week of Ramadan up to the week before Eid with the four weeks that start 8 to 5 weeks before Ramadan. The Ramadan dates are the ones in our Ramadan shopping statistics.
| City | 2022 | 2023 | 2024 | 2025 | 2026 |
|---|---|---|---|---|---|
| Makkah | 154 | 137 | 136 | 130 | 128 |
| Buraidah | 98 | 97 | 99 | 103 | 104 |
| Jeddah | 101 | 102 | 103 | 101 | 103 |
| Madinah | 112 | 107 | 107 | 102 | 100 |
| Abha | 98 | 94 | 92 | 99 | 99 |
| Riyadh | 92 | 97 | 95 | 96 | 98 |
| Hail | 104 | 97 | 101 | 102 | 97 |
| Tabuk | 102 | 99 | 97 | 100 | 97 |
| Dammam | 96 | 98 | 97 | 96 | 95 |
| Khobar | 88 | 91 | 91 | 91 | 90 |
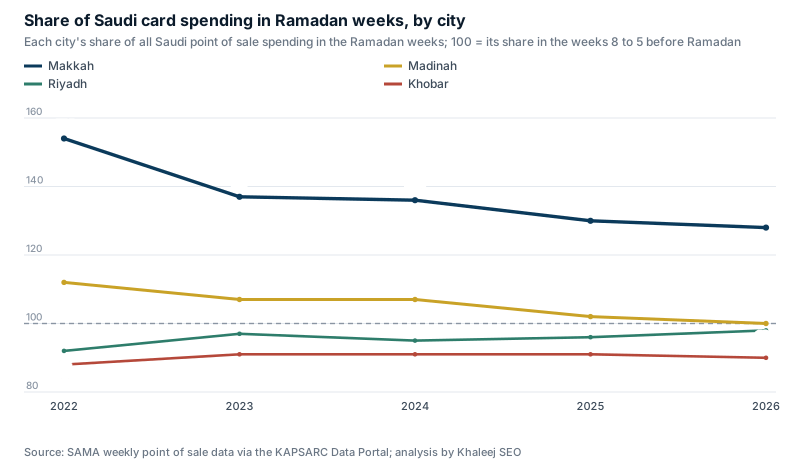
Makkah’s share in Ramadan weeks was 128 to 154 in all five Ramadans and fell every time (154, 137, 136, 130, 128). Madinah went from 112 to 100, which means no gain in 2026. Riyadh sat at 92 to 98 and Khobar at 88 to 91, below 100 in every season, so both hold a smaller share of Saudi spending in Ramadan weeks, and Makkah is the city that gains. Jeddah stayed within 101 to 103. We do not know why the Makkah premium shrinks.
Summer: the highland cities gain
For July we compared the weeks that start in July with the whole calendar year, for 2021 to 2025.
| City | 2021 | 2022 | 2023 | 2024 | 2025 |
|---|---|---|---|---|---|
| Abha | 138 | 140 | 148 | 145 | 138 |
| Hail | 105 | 108 | 104 | 101 | 103 |
| Jeddah | 97 | 99 | 100 | 101 | 101 |
| Madinah | 101 | 102 | 100 | 98 | 100 |
| Riyadh | 95 | 93 | 95 | 97 | 98 |
| Makkah | 88 | 94 | 95 | 96 | 98 |
| Buraidah | 101 | 103 | 100 | 96 | 98 |
| Tabuk | 96 | 95 | 94 | 95 | 96 |
| Dammam | 93 | 94 | 92 | 94 | 95 |
| Khobar | 96 | 92 | 92 | 95 | 94 |
Abha is the only one of the ten cities with a clear July effect: 138 to 148 in all five years. Hail is slightly above 100 (101 to 108) and Makkah is below 100 in every July. The longer series covers only ten cities, so for the others we used the newer 60-city series for July 2025, comparing the four July weeks with the whole 39 weeks (cities with at least 0.4% of spending).
| City | July 2025 index |
|---|---|
| Al Baha | 151 |
| Abha | 139 |
| Taif | 123 |
| Khamis Mushait | 121 |
| Najran | 105 |
Al Baha, Abha, Taif and Khamis Mushait, the four cities in the south-western highlands, gain share in July, from 121 to 151, while Makkah was 95 in the same weeks. This is one summer, so treat it as a pattern to confirm when the archive carries the 2026 summer.
What this means for SEO
This section is our analysis, not a source figure.
- Treat Riyadh and Jeddah as two markets. They hold 48.2% of spending, so a store, clinic or travel firm that serves both needs a page and a plan for each, not one “Saudi Arabia” page. Our SEO agency in Riyadh page carries the Riyadh figures.
- Order city pages by share, then by your own sales. After Riyadh and Jeddah come the Eastern Province (Dammam, Khobar, Qatif), Makkah, Madinah, Buraidah, Taif, Khamis Mushait and Tabuk. A page for a city with a 1% share needs a reason beyond the market size, such as a branch, a delivery promise or a local service area.
- Do not read the falling share as a falling market. Jeddah’s spending grew 29.9% from 2021 to 2025. A Jeddah page should be judged on its own Search Console data, not on the share trend.
- Plan for small, frequent payments. An average of SAR 61.2 (SAR 55 or less in 41 of the 60 cities) means shoppers decide fast, so product and category pages need the price, delivery time and payment options visible without scrolling. Our e-commerce SEO service covers those pages.
- Schedule by city. Travel and hospitality businesses in Abha, Taif and Al Baha should have their summer pages indexed before the July weeks, and sellers who serve Makkah should expect Ramadan to lift their city’s share. The data shows spending, not search demand; check your own city and month in Search Console and in GA4’s city report before you set dates.
- Compare your split with this table. Open Search Console and GA4 for the last 12 months and put your clicks and orders by city next to the shares above. A city with a big share and few clicks is the first page to build or upgrade. Dental clinics can start from patients in Riyadh and Jeddah, and travel firms from our Saudi tourism statistics.
If you want the city split of your own site read from your data, a free SEO audit shows what Google sees today, and our SEO agency in Saudi Arabia page explains how we work with stores, clinics and travel businesses. For the weekly spending context see Saudi shopping seasons.
Methodology and sources
- SAMA, weekly point of sale transactions by sector and city, as republished by the KAPSARC Data Portal (datasource.kapsarc.org), published under “Public Domain” with SAMA as the publisher. Two datasets were used: “Point of Sale Transactions by Sector and City” (31,262 records, weeks starting 10 May 2020 to 6 July 2025, ten cities, “Other” and the national total; last modified 5 May 2026 on the portal) and “Detailed Point of Sale Transactions by Sector and City” (14,168 records, weeks starting 29 June 2025 to 22 March 2026, 60 cities, “Others” and the total; last modified 3 September 2026). Record counts, date ranges and modification dates were read from the portal’s API on 28 October 2026.
- Joining the two series. For the ten-city history we used the earlier series to 6 July 2025 and the newer series from 13 July 2025. In the two overlapping weeks (29 June and 6 July 2025) the two series agree within SAR 1,000 for the six cities we compared (Riyadh, Jeddah, Makkah, Madinah, Abha and Tabuk). One week (starting 21 June 2020) is missing from the source and from our series. In the newer series the 60 cities and “Others” add up to the national total within SAR 3,000 over the 39 weeks.
- What “city” means. The dataset text does not say how a payment is assigned to a city, so we use the city column as published and do not claim to know whether it follows the shop, the terminal or the bank. “Others” is read as the cities not listed separately.
- Value and average payment. Value is in thousand SAR as published and shown in SAR billion. The average payment is value divided by the number of transactions, both as published.
- Ramadan and Eid dates: timeanddate.com holiday pages for Saudi Arabia, as used in our Ramadan shopping statistics. Ramadan weeks run from the Sunday to Saturday week that holds day one up to, not including, the week that holds Eid al-Fitr, which is 4 or 5 weeks (5, 4, 4, 5, 4 for 2022 to 2026). The baseline is the four weeks that start 8 to 5 weeks before the day-one week.
- Our calculations: city share (city value divided by the value of all cities), calendar-year shares and growth, average payment, the Ramadan and July share indexes and the 39-week ranking. Values are rounded to the digits shown.
- Limits: the data counts payments at points of sale in Saudi Arabia and does not include online orders, cash or bank transfers. City shares are shares of spending, not per person: we used no population figures. The newer series ends with the week starting 22 March 2026, and the 60-city view covers 39 weeks and one summer. We did not adjust for prices, for the calendar year of 2023 having 53 weeks, or for the change in sector groups between the two series (which does not affect the all-sector city totals). Causes are not stated because the data does not give them. We used no retailer announcements, paid datasets or survey claims.
Free downloads: saudi-card-spending-by-city.csv holds the 60 cities and the “Others” row with value, share, transactions and average payment for the 39 weeks. saudi-city-share-by-year.csv holds the ten cities, the remaining cities and the national total for 2021 to 2025. saudi-city-seasonality.csv holds the Ramadan and July indexes with their definitions.
How to cite this page
Khaleej SEO, “Saudi card spending by city: Riyadh takes 34.4% and Jeddah 13.8%, and Riyadh’s share has risen every year since 2022”, khaleejseo.com/blog/saudi-card-spending-by-city/, updated 28 October 2026. Name SAMA, through the KAPSARC Data Portal, as the source of the card data. The charts and the CSV files may be reused with this credit and a link.
Updates
- 28 October 2026: first published, with SAMA weekly data to the week starting 22 March 2026. We will add newer weeks when the KAPSARC archive carries them, and repeat the Ramadan and July indexes with the 2027 and 2026 seasons.
Arabic and English SEO specialists for e-commerce stores, dental clinics and travel companies. Our team has led SEO for some of the largest e-commerce brands in the Gulf, across 7 MENA markets.