Saudi digital payments statistics 2026: POS, phones and mada
Official SAMA figures on how Saudi Arabia pays: in-store card spending, contactless and phone payments, terminals and mada online payments, January 2019 to July 2026, with our own analysis and a free monthly CSV.
 The Khaleej SEO team
Published · Updated · 8 min read
Key figures: Saudi Arabia spent SAR 707.2 billion at points of sale in 2025 across 11.55 billion transactions, according to the Saudi Central Bank (SAMA). 96.8% of those payments are now contactless, and phones alone took 50.6% of in-store card spending in 2025, up from 3.2% in 2019. Online, mada card payments reached SAR 46.0 for every SAR 100 spent at shop terminals in 2025, up from SAR 3.6 in 2019.
This page collects the official Saudi digital payments statistics in one place, each with its source and period, and adds our own analysis of SAMA’s monthly point of sale (POS), contactless and mada e-commerce series from January 2019 to July 2026. Compiled by the Khaleej SEO research team; every source below was opened between 3 and 5 October 2026.
Saudi digital payments at a glance
| Figure | Value | Source and period |
|---|---|---|
| Point of sale spending | SAR 707.2 billion, +5.8% | SAMA, full year 2025 vs 2024 |
| Point of sale transactions | 11.55 billion | SAMA, 2025 |
| Average in-store card payment | SAR 61.24 (SAR 177.32 in 2019) | Khaleej SEO calculation from SAMA, 2025 |
| Contactless share of POS transactions | 96.8% | SAMA, July 2026 |
| Phone share of POS spending value | 50.6% (3.2% in 2019) | Khaleej SEO calculation from SAMA, 2025 |
| POS terminals | 2,479,520 (438,618 at the end of 2019) | SAMA, July 2026 |
| mada online payments per SAR 100 spent in store | SAR 46.0 (SAR 3.6 in 2019) | Khaleej SEO calculation from SAMA, 2025 |
| Latest month | SAR 62.8 billion at POS, 1.1 billion transactions | SAMA, July 2026 |
| Electronic share of retail payments | 85% (79% in 2024) | SAMA via SPA, 2025, published 12 April 2026 |
Point of sale spending, year by year
SAMA publishes the value and number of point of sale transactions every month, together with the number of terminals, the contactless (NFC) payments made with cards and with phones, and e-commerce payments made with mada, the national debit card network. We use the full series as republished by the KAPSARC Data Portal, which lists SAMA as the publisher. Our monthly sums equal SAMA’s own annual rows for every year, and the figures match independent reports of SAMA’s releases: SAR 66.1 billion across 997.2 million transactions and 2.4 million terminals for March 2026 (Okaz), and SAR 62.8 billion across 1.1 billion transactions for July 2026 (Mubasher).
| Year | POS spending | Growth | Transactions | Average payment | Contactless share of transactions | Phone share of value | Terminals (December) | mada online per SAR 100 in store |
|---|---|---|---|---|---|---|---|---|
| 2019 | SAR 287.8 billion | 1.62 billion | SAR 177.32 | 56.4% | 3.2% | 438,618 | SAR 3.6 | |
| 2020 | SAR 357.3 billion | +24.2% | 2.85 billion | SAR 125.24 | 88.3% | 15.4% | 721,060 | SAR 10.9 |
| 2021 | SAR 473.3 billion | +32.5% | 5.17 billion | SAR 91.52 | 94.9% | 27.1% | 1,013,233 | SAR 15.7 |
| 2022 | SAR 559.1 billion | +18.1% | 7.26 billion | SAR 77.00 | 96.5% | 33.3% | 1,438,121 | SAR 21.9 |
| 2023 | SAR 614.0 billion | +9.8% | 8.97 billion | SAR 68.43 | 96.3% | 36.2% | 1,739,070 | SAR 25.6 |
| 2024 | SAR 668.2 billion | +8.8% | 10.37 billion | SAR 64.41 | 95.8% | 47.1% | 1,981,111 | SAR 29.5 |
| 2025 | SAR 707.2 billion | +5.8% | 11.55 billion | SAR 61.24 | 95.9% | 50.6% | 2,330,051 | SAR 46.0 |
Download the monthly series as CSV: month, POS spending, transactions, terminals, average payment, contactless and phone shares, mada e-commerce and our online-per-100 ratio, January 2019 to July 2026.
Phones overtook cards at the till
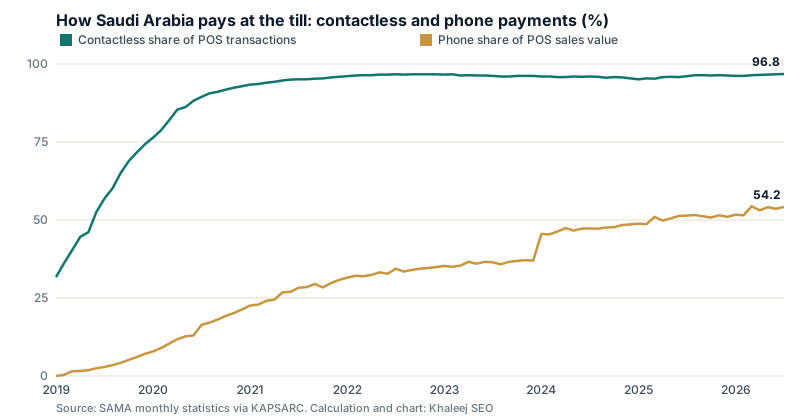
Three findings from the monthly series:
- Contactless became the default in 2020. The contactless share of transactions passed 90% in August 2020 and has stayed between 95.1% and 96.8% every month since July 2021. Tapping is no longer a trend in Saudi Arabia; it is simply how people pay.
- Phones took the lead in 2024. SAMA splits contactless spending into cards and phones. In 2023 phones accounted for SAR 222.6 billion against SAR 353.1 billion for contactless cards. In 2024 phones passed cards for the first time (SAR 314.8 billion against SAR 311.3 billion), and in 2025 the gap widened to SAR 358.1 billion against SAR 309.4 billion. In March 2025, phones crossed half of all point of sale spending value in a single month, and they reached 54.2% in July 2026.
- Payments got smaller and more frequent. The average in-store card payment fell from SAR 177.32 in 2019 to SAR 61.24 in 2025, while the number of transactions grew about seven times. Cards and phones now pay for coffee, fuel and groceries, not only for large purchases. The fall shows city by city in Saudi card spending by city: the average payment is lower in 2025 than in 2021 in all ten cities of the long series.
A note on the data: the phone share of value jumps by about 8 points between December 2023 and January 2024, much faster than in any other month. SAMA’s dataset does not explain the step, so we report it as it is published and do not read a single-month cause into it.
Online is catching up with the till
mada e-commerce is a narrower measure than point of sale spending: it counts only payments with mada debit cards on websites, apps and e-wallets. Even so, the ratio between the two shows where spending is moving. For every SAR 100 spent at Saudi shop terminals, mada cards paid SAR 3.6 online in 2019, SAR 29.5 in 2024 and SAR 46.0 in 2025. In the first half of 2026 the ratio was SAR 54.2, and in July 2026 it reached SAR 59.9 (SAR 37.6 billion online against SAR 62.8 billion in store).
Over the same period, in-store spending growth slowed from +32.5% in 2021 to +5.8% in 2025, and the first half of 2026 was 6.1% above the first half of 2025. In-store card spending is still growing, but the faster growth is online. Our Saudi e-commerce statistics cover the mada online series in detail, and our analysis of SAMA’s weekly card data shows which sectors rise in each shopping season.
Read the ratio carefully: it compares mada online payments (debit cards only) with all card payments at terminals, so it is a Khaleej SEO indicator of direction, not a market share.
What this means for Saudi businesses
- The phone is now the wallet and the shop window. When more than half of in-store spending is paid with a phone, the same phone is where customers search before they visit. For clinics, showrooms and restaurants, that search usually happens on Google Maps; for stores, on Google in Arabic. Our SEO services in Saudi Arabia start from those searches.
- Online is where the growth is. With mada online payments close to 60% of in-store card spending in July 2026, a store that is invisible on Google is missing the faster-growing half of the market. That is the gap our e-commerce SEO work closes, including for stores on Salla.
- Small baskets need easy checkout and clear product pages. Average payments keep falling. Shoppers buying smaller, more frequent orders decide fast, so product and category pages need prices, delivery and payment options visible without scrolling.
To see how your own site performs in Saudi search, request a free SEO audit.
Methodology and sources
- Point of sale, contactless and mada e-commerce: SAMA monthly statistics as republished on the KAPSARC Data Portal (dataset “Points of Sale Transactions and E-Commerce Transactions (Mada Cards)”, publisher Saudi Central Bank, last modified 15 September 2026), downloaded 3 October 2026. Series used: Total POS sales, number of transactions and number of terminals; POS transactions using NFC technology, sales and number of transactions, split into cards and mobile; e-commerce transactions using mada cards, sales and number of transactions. Monthly values January 2019 to July 2026.
- Consistency checks: monthly values summed to calendar years equal SAMA’s annual rows for 2019 to 2025. March 2026 and July 2026 values match the SAMA figures reported by Okaz and Mubasher (links above), opened 5 October 2026.
- Our calculations: growth rates, average payment (sales divided by transactions), contactless share (card plus phone NFC transactions divided by all POS transactions), phone share of value (phone NFC sales divided by all POS sales) and the online-per-100 ratio (mada e-commerce sales divided by POS sales, times 100). All are labelled as Khaleej SEO calculations.
- Electronic payments share: Saudi Press Agency, “SAMA: E-Payments Account for 85% of Total Retail Payments in 2025”, 12 April 2026.
- Not included: wallet brand shares, buy now pay later volumes and vendor market size estimates, because we found no official monthly source for them that we could open and check.
How to cite this page
Cite the Saudi Central Bank (SAMA) as the source of each figure. For the calculations, the chart or the compilation, please credit “Khaleej SEO analysis of SAMA data” and link to this page. The chart may be reused with that credit.
Updates
- 5 October 2026: first published, with SAMA monthly data to July 2026. We update this page when SAMA’s next monthly figures are republished.
Arabic and English SEO specialists for e-commerce stores, dental clinics and travel companies. Our team has led SEO for some of the largest e-commerce brands in the Gulf, across 7 MENA markets.