Saudi online shopping in 2026: 74.5% buy online, and 68.2% of shoppers now use global stores
GASTAT's 2026 and 2025 household surveys side by side: who shops online by gender, nationality and age, what they buy, which stores they use, how orders arrive, and which year-on-year changes can be trusted.
 The Khaleej SEO team
Published · Updated · 11 min read
Key finding: 74.5% of people in Saudi Arabia aged 15 to 74 bought goods or services online in the three months before GASTAT’s 2026 survey, up from 71.0% in 2025, and 84.9% of Saudis did. Among shoppers, use of global stores rose from 44.6% to 68.2% and collecting from a point of sale from 41.0% to 67.9%.
The General Authority for Statistics (GASTAT) published the 2026 results of its ICT access and usage survey for households and individuals on 31 October 2026 (the upload timestamp on its download links). As of 2 November the first news items quote only the headline figures, such as 99.6% internet use. We went to the Excel publication tables behind the one-page bulletin, 63 tables for each of 2026 and 2025, and used 19 of the 2026 tables and 24 of the 2025 tables, covering online shopping, looking up goods online, e-banking and ad blocking. The original parts are the like-for-like comparison with the category changes marked, a range for each age band that GASTAT re-cut, the gender and nationality gaps by category, and a check against card spending data.
Saudi online shopping at a glance
Each figure is the share of individuals aged 15 to 74 who bought goods or services online in the three months before the household visit. The 2026 bulletin words it as a share of internet users, and the tables as a share of individuals. With 99.6% of individuals online the two readings differ by 0.3 points, so it changes no conclusion.
| Share who bought online | 2025 | 2026 | Change (pts) |
|---|---|---|---|
| All individuals 15 to 74 | 71.0% | 74.5% | +3.5 |
| Men | 68.4% | 71.4% | +3.0 |
| Women | 76.1% | 80.6% | +4.5 |
| Saudis | 80.2% | 84.9% | +4.7 |
| Saudi men | 77.6% | 83.1% | +5.5 |
| Saudi women | 82.8% | 86.8% | +4.0 |
| Non-Saudis | 63.1% | 66.1% | +3.0 |
| Non-Saudi men | 63.4% | 65.5% | +2.1 |
| Non-Saudi women | 62.0% | 68.4% | +6.4 |
- Every one of the nine groups rose. The biggest rises were non-Saudi women (+6.4 points) and Saudi men (+5.5). Overall the share rose by 4.9% in relative terms.
- Women lead. 80.6% of women bought online against 71.4% of men, a gap of 9.2 points (7.7 in 2025). Non-Saudi women overtook non-Saudi men in 2026 (68.4% against 65.5%), after trailing in 2025 (62.0% against 63.4%).
- Saudis shop more than non-Saudis, by 18.8 points in 2026 (17.1 in 2025). The broader market picture is in our Saudi e-commerce statistics page.
Who shops online: age and education
GASTAT re-cut the age bands in 2026. The 2025 tables had twelve bands of five years and the 2026 tables have six bands of ten years. A share for a merged band must lie between the shares of the finer bands it combines, so the table shows the 2025 range and the change as a range.
| Age band (2026) | 2026 | 2025 (finer bands, low to high) | Change (pts, low to high) |
|---|---|---|---|
| 15-24 | 79.7% | 83.2% to 83.3% | -3.6 to -3.5 |
| 25-34 | 75.3% | 74.8% to 75.3% | 0.0 to +0.5 |
| 35-44 | 73.0% | 71.3% to 73.3% | -0.3 to +1.7 |
| 45-54 | 73.7% | 53.3% to 67.9% | +5.8 to +20.4 |
| 55-64 | 67.5% | 38.8% to 43.7% | +23.8 to +28.7 |
| 65-74 | 62.9% | 26.3% to 35.0% | +27.9 to +36.6 |
- The age curve flattened. In 2026 the gap between the youngest band (79.7%) and the oldest (62.9%) is 16.8 points. In 2025 the best band reached 83.3% and the oldest band, 70 to 74, was 26.3%, a gap of 57.0 points.
- The movement is in the older bands. The 55 to 64 band moved by +23.8 to +28.7 points and 65 to 74 by +27.9 to +36.6, while 25 to 44 stayed within about two points and 15 to 24 fell by 3.5 to 3.6 points.
- Treat the older-age jump with care. A rise of 28 to 37 points in one year is far larger than any other change in the age table, GASTAT does not explain it and the tables carry no margin of error. We would not plan around it until the 2027 release shows whether it holds.
The 2026 tables have no education table, so the last reading is from 2025. Online buying rose with qualification and then dipped at the top:
| Highest qualification | Share who bought online (2025) |
|---|---|
| Primary | 32.6% |
| Intermediate school | 69.8% |
| Secondary | 82.3% |
| Associate’s diploma | 82.0% |
| Intermediate diploma | 89.6% |
| Bachelor’s degree | 89.6% |
| Master’s degree | 89.7% |
| PhD | 82.5% |
From primary education (32.6%) to a master’s degree (89.7%) the share rises by 57.1 points. The 2025 survey does not say why PhD holders (82.5%) are below master’s holders.
What Saudis buy online
The category shares in GASTAT’s tables are shares of online shoppers, and a shopper can name several categories. In 2026 the eleven categories add up to 3.5 categories per shopper, against 3.3 across fifteen categories in 2025. Because the 2026 list is shorter and merged, the 2026 figure, if anything, understates the rise in breadth.
GASTAT changed the wording of some categories in 2026, so only 8 can be compared like for like:
| Category (share of online shoppers who bought it) | 2025 | 2026 | Change (pts) |
|---|---|---|---|
| Food, groceries or tobacco | 38.5% | 54.4% | +15.9 |
| Tickets or bookings for entertainment | 19.4% | 44.6% | +25.2 |
| Travel products | 20.0% | 37.4% | +17.4 |
| ICT services (excluding software) | 18.9% | 23.5% | +4.6 |
| Books, magazines or newspapers | 8.7% | 22.8% | +14.1 |
| Computer equipment or spare parts | 15.0% | 13.6% | -1.4 |
| Computer software | 9.1% | 9.5% | +0.4 |
| Photographic or optical equipment | 3.7% | 6.1% | +2.4 |
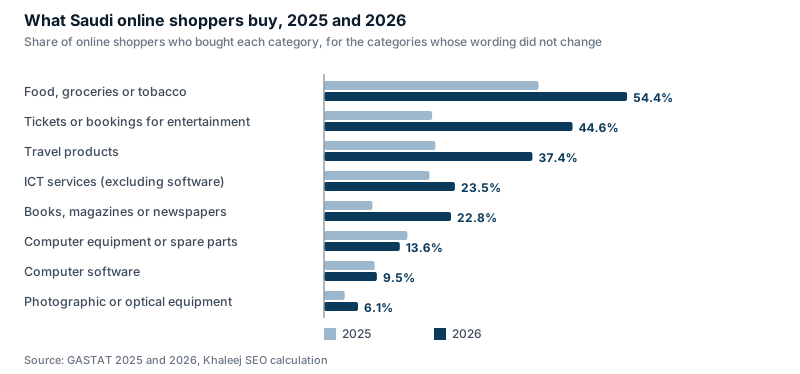
- Seven of the eight rose, though software (+0.4) is within noise. Tickets or bookings for entertainment more than doubled (2.3 times, 25.2 points), books, magazines or newspapers rose 2.6 times, and travel products 1.9 times. Only computer equipment fell (-1.4).
- Food and groceries are now the second most bought category. 54.4% of online shoppers bought food, groceries or tobacco in 2026, up 15.9 points.
- The three merged categories cannot be compared. In 2026 the clothing row also covers household goods, the cosmetics row also covers medications, and the film row also covers music:
| 2026 category as labelled | 2026 | The 2025 categories it appears to cover |
|---|---|---|
| Clothing, shoes, sports goods or household goods, and others | 85.2% | Clothing 88.8%, household goods 31.4% |
| Cosmetics or medications | 45.9% | Cosmetics 40.2%, medicines 16.9% |
| Movies, short films, images or music products | 7.3% | Movies 6.7%, music 3.6% |
The 2026 bulletin and table titles show the merge, and GASTAT does not publish a concordance, so the right-hand column is our reading, and we do not read the clothing figure (85.2% against 88.8%) as a fall.
Women, men and nationality by category
Women are more likely to shop online, yet among shoppers the men are ahead in 7 of the 11 categories. The table shows the four categories where women are furthest ahead and the two where men are furthest ahead in 2026.
| Category (2026) | Women | Men | Women minus men (pts) |
|---|---|---|---|
| Cosmetics or medications | 75.1% | 29.1% | +46.0 |
| Clothing, shoes, sports goods or household goods | 92.0% | 81.2% | +10.8 |
| Books, magazines or newspapers | 25.1% | 21.4% | +3.7 |
| Movies, short films, images or music | 8.0% | 6.8% | +1.2 |
| Tickets or bookings for entertainment | 37.4% | 48.7% | -11.3 |
| Travel products | 26.9% | 43.4% | -16.5 |
- Cosmetics or medications is the widest gap of all: 75.1% of women who shop bought it against 29.1% of men, 46.0 points. Clothing, shoes, sports goods or household goods is the most bought category in every group, and 92.0% of women shoppers bought it against 81.2% of men.
- Men lead on travel and tickets: 43.4% against 26.9% for travel products and 48.7% against 37.4% for entertainment tickets.
- Non-Saudi shoppers buy travel products almost twice as often as Saudi shoppers (49.3% against 25.7%), and tickets 52.3% against 37.1%. Saudi shoppers are ahead in only 3 of the 11 categories (clothing, cosmetics or medications, and books).
Nationality shows a different pattern. These are the five widest gaps between Saudi and non-Saudi shoppers in 2026:
| Category (2026) | Saudis | Non-Saudis | Saudis minus non-Saudis (pts) |
|---|---|---|---|
| Travel products | 25.7% | 49.3% | -23.6 |
| ICT services (excluding software) | 15.2% | 32.0% | -16.8 |
| Cosmetics or medications | 53.9% | 37.7% | +16.2 |
| Tickets or bookings for entertainment | 37.1% | 52.3% | -15.2 |
| Clothing, shoes, sports goods or household goods | 91.5% | 78.7% | +12.8 |
The full table, with every category by gender and nationality, is in the free CSV below.
Where Saudis buy and how it arrives
Shoppers can use more than one kind of store and more than one delivery method, so each column is a share of shoppers and the columns do not add to 100%.
| Share of online shoppers who | 2025 | 2026 | Change (pts) |
|---|---|---|---|
| Shop at local online stores | 92.8% | 96.1% | +3.3 |
| Shop at global online stores | 44.6% | 68.2% | +23.6 |
| Receive goods by direct physical delivery | 89.6% | 95.0% | +5.4 |
| Collect from a point of sale | 41.0% | 67.9% | +26.9 |
| Receive goods or services electronically | 37.2% | 45.1% | +7.9 |
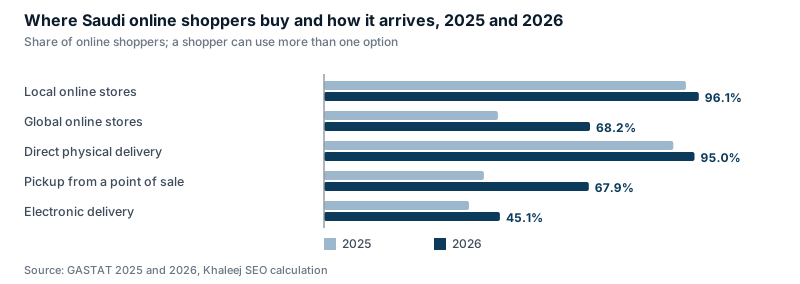
- Local stores are close to universal (96.1%), and global stores are now used by about two in three shoppers (68.2%, up 23.6 points). The two shares add to 164.3%, so at least 64.3% of shoppers used both.
- The nationality gap in global stores closed. In 2025 Saudi shoppers led non-Saudi shoppers by 16.0 points (52.2% against 36.3%). In 2026 non-Saudis are marginally ahead (69.0% against 67.4%), because their use rose by 32.7 points and Saudis’ by 15.2.
- Collecting from a point of sale jumped from 41.0% to 67.9%, and the nationality gap shrank from 18.6 to 6.4 points (Saudis 71.1%, non-Saudis 64.7%). The delivery shares add to 208.0%, so the average shopper used about two methods.
- CST’s Saudi internet report has local websites at 95.3% and international ones at 55.4%, with a base CST does not state; we cover it on our Saudi internet statistics page. GASTAT’s 2026 survey puts them at 96.1% and 68.2%. The surveys differ, but both show local stores near universal.
Looking things up before buying
Two indicators in the same survey sit upstream of the purchase. GASTAT counts the share of internet users who use the internet to obtain information about goods or services, and the share who use travel or accommodation services online. Two more, e-banking and ad blocking, frame how shoppers pay and what they see.
| Indicator (individuals 15 to 74) | 2025 | 2026 | Change (pts) |
|---|---|---|---|
| Internet users | 99.0% | 99.6% | +0.6 |
| Look for information about goods or services online | 57.2% | 65.4% | +8.2 |
| Use travel or accommodation services online | 33.4% | 41.2% | +7.8 |
| Use electronic banking services | 79.4% | 84.5% | +5.1 |
| Enable ad blocking in apps | 12.9% | 12.5% | -0.4 |
- Two in three look up goods or services online (65.4% in 2026, up 8.2 points from 57.2%). Men are at 66.2% and women at 63.9%. Among non-Saudis the share rose from 52.9% to 65.2%, and among Saudis from 62.2% to 65.7%.
- About one person in eight enables ad blocking in apps (12.5%, 12.9% in 2025). GASTAT does not say which ads or apps.
- GASTAT does not say where people look: a search engine, a marketplace app, social media or a shop’s own site all count. The figure shows that the research step exists and is growing, not which channel wins it.
Does spending follow the shoppers?
SAMA’s monthly mada e-commerce series, as mirrored by KAPSARC (our local copy runs through July 2026), shows value growing far faster than the share of shoppers. Mada online payments grew 64.7% in 2025 (SAR 325.2 billion against SAR 197.4 billion), and 35.1% in January to July 2026 against the same months of 2025 (SAR 237.5 billion against SAR 175.8 billion). The share of people who shop rose 4.9% in relative terms.
The two measures are different. One counts people who bought in the last three months, the other counts the value of one card network’s online payments, and payments can also move between cards and other methods. Even so, a 4.9% rise in the share of shoppers cannot account for 35.1% growth in value, so most of the growth is in what each shopper spends or in how they pay, not in how many people shop. Our Saudi digital payments statistics page covers the payment side.
What these figures do not show
- Shares, not spend. Nothing here says how much a shopper spends or how often they buy. The question covers the three months before the household visit.
- The 2026 categories changed. Three pairs were merged, four category rows (household goods, medicines, games and music) have no separate 2026 row, and games are no longer a purchase category (the 2026 tables ask only whether people play games online). Like-for-like comparison is limited to 8 categories.
- Some changes are very large and unexplained. Tickets rose 25.2 points, travel 17.4, food 15.9 and books 14.1 in one year. GASTAT states the survey is comparable over time and the methodology report we read describes no questionnaire change, but it also publishes no margin of error, so we report the changes as published and read moves of about one or two points as noise.
- Age bands differ, so the age comparison is a range and not a point.
- Different bases. Who buys is a share of individuals aged 15 to 74, including non-Saudi residents. What, where and how are shares of online shoppers.
- Other surveys differ. CST, SAMA and market research firms measure different things, and we compare them only as context.
What this means for Saudi online stores
This section is our analysis, not a source figure.
- Plan for the research step. 65.4% of internet users look up goods or services online, and the share is growing. Category and product pages that answer the questions a shopper asks before buying are the part of the store that a search can reach; see our e-commerce SEO service and the Salla store SEO guide.
- Treat the physical store as part of the online store. 67.9% of shoppers collected an order from a point of sale. A store with branches needs branch pages and map listings that show pickup, which is a local search job; our SEO agency in Riyadh page explains the approach for the capital.
- Expect global stores in every comparison. 68.2% of shoppers used a global store, and non-Saudi residents now use them as often as Saudis do. A local store wins on delivery, returns and Arabic content, so the Arabic SEO work matters more, not less.
- Follow the categories that grew. Groceries, entertainment tickets, travel products and books grew the most among comparable categories. For travel businesses, 41.2% of internet users used travel or accommodation services online and non-Saudi shoppers buy travel products at nearly twice the Saudi rate; see our travel SEO page.
- Write for both genders. Women shop online more (80.6% against 71.4% of men) and, among shoppers, buy cosmetics or medications at 46.0 points above men, while men lead on travel and tickets. Product and category copy should not assume one reader.
- Know what the seller side looks like. In GASTAT’s establishment survey, 33.5% of establishments sold or displayed online in 2025 against 47.6% that bought online, and in all 18 activities more establishments buy than sell; see our Saudi businesses online statistics.
For a plan built on your own data, a free SEO audit shows what Google sees on your store today, and the SEO agency in Saudi Arabia page explains how we work with growing businesses. The same survey’s earlier results and the market size are in our Saudi e-commerce statistics.
Methodology and sources
- GASTAT, ICT Access and Usage Statistics for Households and Individuals 2026 and 2025: publication tables (Excel, 63 tables each, Arabic and English), downloaded on 2 November 2026 from GASTAT’s 2026 release page and the link printed in the 2025 bulletin. The download links for the 2026 files carry an upload timestamp of 31 October 2026. We loaded the online-shopping tables and checked them against both one-page bulletins: the headline shares for 2026 and 2025, the sub-group figures the bulletins print for Saudis, Saudi women and Saudi men, the 11 category values in the 2026 bulletin chart and the 15 in the 2025 chart, and the information-seeking figures. All matched.
- GASTAT, Methodology and Quality Report for ICT Access and Usage Statistics for Households and Individuals: the unit (individuals aged 15 to 74), the three-month reference period, the 13 administrative regions, the two-stage stratified cluster sample, and the statement that the survey began in 2017 and is comparable over time. The report gives the sample design and the allowable error used to size the sample, but we found no total sample size or published margin of error for the estimates.
- Saudi Central Bank (SAMA) monthly statistics, mada e-commerce, through July 2026 as mirrored on the KAPSARC data portal, used only for the cross-check.
- Our calculations: changes in points and relative terms, the ranges for re-cut age bands (a merged share lies between its parts), the nationality and gender gaps by category, the categories-per-shopper sums and the at-least-both-store lower bound. Values are rounded to the digits shown.
Free downloads: saudi-online-shopping-2025-2026.csv holds every online-shopping indicator used here for both years, by gender and nationality. saudi-online-shopping-by-age-2025-2026.csv holds the age bands for both years and the 2025 education split. saudi-online-shopping-gender-gaps-2026.csv holds the 2026 gender and nationality gaps for all 11 categories.
How to cite this page
Khaleej SEO, “Saudi online shopping in 2026: 74.5% buy online, and 68.2% of shoppers now use global stores”, khaleejseo.com/blog/saudi-online-shopping-statistics/, updated 2 November 2026. Name GASTAT as the source of the underlying figures. The charts and the CSV files may be reused with this credit and a link.
Updates
- 2 November 2026: first published, two days after GASTAT released its 2026 tables. We will update the page when GASTAT publishes the 2027 results, and if GASTAT publishes a concordance for the merged 2026 categories.
Licence: the compilation, calculations, charts and CSV files on this page are shared under CC BY 4.0: credit Khaleej SEO and link to this page. Source figures stay under their publisher's terms, so credit the source named next to each figure.
Arabic and English SEO specialists for e-commerce stores, dental clinics and travel companies. Our team has led SEO for some of the largest e-commerce brands in the Gulf, across 7 MENA markets.