Qatar tourism statistics: 2025 visitors, hotels and the months that matter
How many tourists visit Qatar, when they come, where they come from, how full the hotels are and how far the country is from its 2030 target. Official Qatar Tourism figures, the 2026 numbers so far, our analysis and a free CSV with the source of every number.
 The Khaleej SEO team
Published · Updated · 9 min read
Key finding: Qatar’s tourism year is a winter year. In 2025, January, February, November and December brought 45.8% of the country’s 5.1 million visitors, and hotels ran at 82.5% occupancy in those months against 63.2% from June to September. December alone brought 674,144 visitors, 2.47 times September. The pattern now carries more weight than ever: from January to September 2026 arrivals were 26.4% below the same months of 2025, after a fall of 75.3% in March and April, and September was the first month since January to beat its 2025 level.
The figures below come from Qatar Tourism: its 2025 and 2024 Annual Performance Reports, its official arrivals and accommodation dashboard (data as of 30 September 2026), and its press releases, plus the National Planning Council’s development strategy and the Qatar News Agency. Where we did the arithmetic, we say so. Compiled by the Khaleej SEO research team; every source below was opened on 18 October 2026.
Qatar tourism at a glance
| Figure | Value | Source and period |
|---|---|---|
| International visitor arrivals | 5.1 million (5,090,901), +3.7% | Qatar Tourism, 2025 |
| Visitors in the first nine months of 2026 | 2.61 million, 26.4% below Jan to Sep 2025 | Qatar Tourism dashboard; change is a Khaleej SEO calculation |
| Busiest month | December 2025, 674,144 visitors | Qatar Tourism dashboard |
| Arrivals by air, land and sea | 61%, 32%, 7% | Qatar Tourism, 2025 report |
| Largest source region | GCC, 35% of visitors | Qatar Tourism, 2025 report |
| Full market hotel occupancy | 71.3%, +2.6 points | Qatar Tourism with STR, 2025 |
| Room keys | 42,469 at December 2025 | Qatar Tourism with STR |
| Room nights sold | 10.84 million, +8.6% | Qatar Tourism with STR, 2025 |
| Average daily rate | QAR 457, +3.6% | Qatar Tourism with STR, 2025 |
| Accommodation revenue | QAR 8.3 billion, +12% | Qatar Tourism press release, 21 January 2026 |
| 2030 target | 6 million visitors | National Planning Council, NDS3 |
How many tourists visit Qatar?
Qatar Tourism counted 5,090,901 international visitor arrivals in 2025, up 3.7% on 2024. The series shows how far the country has come since the years before the FIFA World Cup:
| Year | Visitor arrivals | Change |
|---|---|---|
| 2019 | 2,136,525 | baseline |
| 2022 (World Cup year) | 2,552,510 | +19.5% on 2019 |
| 2023 | 4,046,281 | +58.5% |
| 2024 | 4,906,898 | +21.3% |
| 2025 | 5,090,901 | +3.7% |
Source: Qatar Tourism dashboard; changes are Khaleej SEO calculations. Qatar Tourism does not publish a definition of “visitor” alongside these figures, so read them as visitor arrivals as reported by Qatar Tourism, by air, land and sea. Land arrivals were almost zero in 2019 (8 in the series), so any comparison with 2019 understates how much road travel from the rest of the Gulf now adds.
Two growth stories sit inside the 2025 total. Arrivals by air rose 12.5% to 3.13 million, while arrivals by land fell 8.0% to 1.63 million and by sea 6.4% to 332,048. Sea arrivals follow the cruise season, but they are not a count of cruise passengers.
When visitors come: Qatar’s winter peak
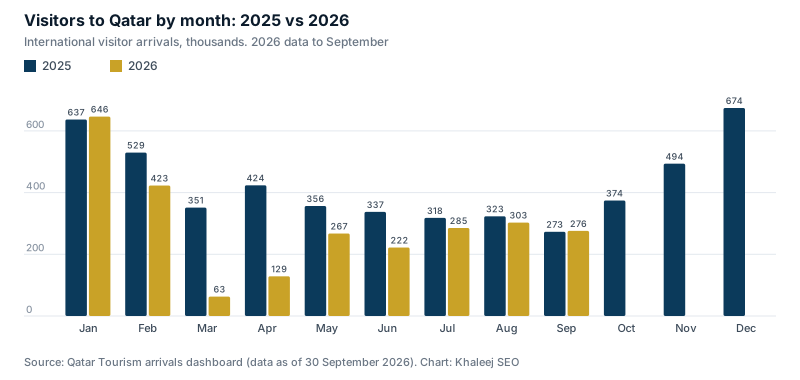
Visitors to Qatar cluster in the cooler months. Taking 100 as the 2025 monthly average of 424,242 visitors, December stood at 159 and January at 150, while September stood at 64 (Khaleej SEO calculation). The four winter months of January, February, November and December carried 47.9% of arrivals in 2024 and 45.8% in 2025.
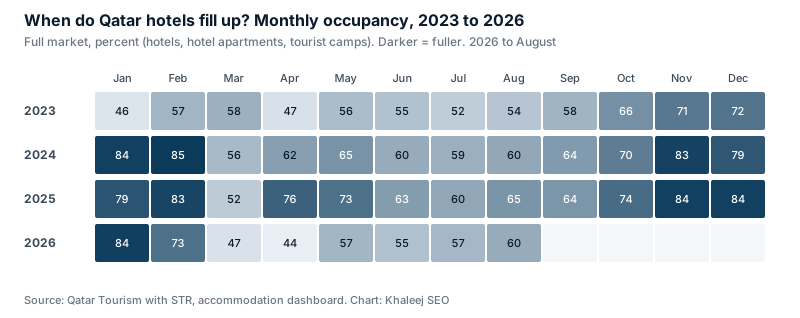
Hotels follow the same calendar. Full market occupancy reached 85.2% in February 2024 and 83.9% in both November and December 2025, and averaged 82.5% across the four winter months of 2025, against 63.2% from June to September: a gap of 19.3 points. March is the weak point of the winter. In 2024 and 2025, when most of Ramadan fell in March, occupancy dropped to 56.2% and 52.5% before recovering in April.
Qatar Tourism tied December 2025’s 674,000 visitors, nearly 16% more than in December 2024, to major international events including the FIFA Arab Cup. Events and the winter season land in the same months, which concentrates demand even further.
2026 so far: a spring fall and a slow return
| Period | 2025 | 2026 | Change |
|---|---|---|---|
| January | 636,874 | 646,266 | +1.5% |
| February | 529,391 | 422,869 | -20.1% |
| March and April | 774,930 | 191,605 | -75.3% |
| May to August | 1,334,888 | 1,077,277 | -19.3% |
| September | 272,875 | 275,699 | +1.0% |
| January to September | 3,548,958 | 2,613,716 | -26.4% |
Source: Qatar Tourism dashboard, data as of 30 September 2026; changes are Khaleej SEO calculations. The Qatar News Agency reported the nine-month total as 2.614 million on 6 October 2026. Qatar Tourism has not published a reason for the March and April fall, so we report the numbers without guessing at one.
Hotels felt it too. Full market occupancy averaged 59.6% from January to August 2026, against 69.0% in the same months of 2025, and room nights sold were 11.0% lower (Khaleej SEO calculation from the dashboard). January 2026 was still a strong month at 84.1%.
Where visitors come from: fewer GCC road trips, more long-haul flights
| Region | 2024 | 2025 | Change | Share 2025 |
|---|---|---|---|---|
| GCC | 1,932,766 | 1,810,469 | -6.3% | 35.6% |
| Europe | 1,152,883 | 1,258,758 | +9.2% | 24.7% |
| Other Asia, including Oceania | 1,013,180 | 1,107,844 | +9.3% | 21.8% |
| Other Arab countries | 383,828 | 408,829 | +6.5% | 8.0% |
| Americas | 318,407 | 356,990 | +12.1% | 7.0% |
| Other Africa | 105,737 | 147,867 | +39.8% | 2.9% |
Source: Qatar Tourism dashboard; changes and exact shares are Khaleej SEO calculations (the 2025 report rounds the shares to 35%, 25%, 22%, 8%, 7% and 3%).
The GCC is still the biggest source region, and it is the one that shrank in 2025, in line with the drop in land arrivals. Every other region grew, led by long-haul markets. Europe sent 84.8% more visitors in 2025 than in 2019. In the first nine months of 2026 the GCC share rose back to 40.9% (1,069,092 visitors), with Europe at 20.6%, because arrivals from further away fell harder.
For individual countries, Qatar Tourism’s most recent official ranking names Saudi Arabia, India, the United Kingdom, Germany and the United States as the top five source markets of 2024. Its latest published share is for 2023, when Saudi Arabia accounted for 25.3% of international arrivals.
Hotels: supply, occupancy and rates
| Measure (full market, 2025) | Value | Change on 2024 |
|---|---|---|
| Room keys, December 2025 | 42,469 | +5.1% (40,405 a year earlier) |
| Average occupancy | 71.3% | +2.6 points |
| Occupancy in 5-star hotels | 65.6% | 63.6% in 2024 |
| Occupancy in 4-star hotels | 69.0% | unchanged |
| Occupancy in 1 to 3 star hotels | 85.4% | 84.7% in 2024 |
| Occupancy in hotel apartments | 80.9% | 74.5% in 2024 |
| Room nights sold | 10.84 million | +8.6% |
| Average length of stay | 3.5 nights | 3.6 in 2024 |
| Average daily rate | QAR 457 | +3.6% |
| Revenue per available room | QAR 326 | +7.6% |
Source: Qatar Tourism with STR, 2025 and 2024 Annual Performance Reports. Full market covers hotels, hotel apartments and tourist camps. Almost half of the room keys (20,789) are in 5-star hotels, yet the smaller and cheaper categories ran fuller: 1 to 3 star hotels at 85.4% and hotel apartments at 80.9%. Total accommodation revenue reached QAR 8.3 billion in 2025, up 12%, and the MICE sector received more than one million international business visitors, according to Qatar Tourism.
Qatar against its 2030 tourism targets
Qatar’s Third National Development Strategy sets three tourism targets for 2030: 6 million visitors, QAR 34 billion of total in-destination spending and up to 19 million room nights. Measured against 2025, the country is 84.8% of the way to the visitor target and 57.2% of the way to the room-night target (Khaleej SEO calculation). From the 2025 level, about 3.3% growth a year would reach 6 million by 2030. The first nine months of 2026 moved in the other direction, so the remaining years carry more of the climb. Qatar Tourism has also described an aim of a 10% to 12% total contribution of tourism to GDP; the latest official direct share is 2.86% for 2022, a provisional estimate.
Where the sources disagree
- 2024 has four official totals. 4,906,898 on the current dashboard, 4.91 million in the 2024 report, 5,050,811 in an older Qatar Tourism dataset on the national open data portal, and 5.08 million in the release of 1 January 2025. The series was revised down and no reason is given. We use the dashboard figure.
- 2024 growth is 26% in the 2024 report and 21.3% on the revised series. The report compared 2024 with an older 2023 total of about 3.89 million; the dashboard now gives 4,046,281 for 2023.
- Two publishers, two series. The National Planning Council’s monthly arrivals for 2024 run 2.6% to 5.4% above Qatar Tourism’s, and neither publisher explains the gap. We use Qatar Tourism throughout.
- 2024 occupancy appears as 68.7%, 68.8%, 69% and 69.3% across the two annual reports. We use 68.7%, the figure restated in the 2025 report.
- August 2026 rose month on month and fell year on year. A news agency summary described the month as up 6.3%; on the dashboard, August 2026 (302,754) is 6.2% above July but 6.3% below August 2025.
What this means for hotels, tour operators and travel companies
- Have winter pages live by September. Demand peaks from November to February, and pages need time to be crawled and ranked. A permanent page for the winter season, the events calendar and each major event, updated every year at the same address, keeps the authority it builds. Our travel and hotel SEO work starts these pages before the season, not during it.
- Write for GCC visitors in Arabic. The GCC sends more than a third of Qatar’s visitors, and 40.9% in 2026 so far. They search in Gulf Arabic, often by car and for short stays, so Arabic pages need their own keyword research rather than a translation. Our Arabic SEO service and our Arabic keyword research guide explain how.
- Keep English pages for the long-haul growth. Europe, Asia and the Americas all grew in 2025 and arrive by air. English pages that answer trip planning questions (when to go, how long to stay, what to book) meet them before they choose a hotel.
- Hotel apartments and mid-range hotels are where occupancy is highest. At 80.9% and 85.4% occupancy, these categories compete on availability and location searches more than on brand. Room, district and landmark pages in both languages win those searches.
- Measure the season, not the month. With a 19-point gap between winter and summer occupancy, compare each month with the same month a year earlier. Our SEO agency in Qatar page explains how we plan this for Doha businesses, and the Saudi, Omani and Bahraini pictures are in our Saudi Arabia tourism statistics, Oman tourism statistics and Bahrain tourism statistics.
Want to know whether your site is ready for the winter season? Ask for a free SEO audit and we will send the issues holding it back within 48 hours.
Methodology and sources
- Qatar Tourism, 2025 Annual Performance Report (PDF): visitors, shares by region and port of entry, occupancy by category, room keys, room nights, average stay, average daily rate and revenue per available room (pages 2 to 9).
- Qatar Tourism, 2024 Annual Performance Report (PDF): 2024 figures and the 2023 base.
- Qatar Tourism, arrivals and accommodation dashboard (tourism dashboards page): monthly arrivals by port of entry and by region from 2019 to September 2026, and monthly full market occupancy, demand and rates from 2019 to August 2026. We exported each view as CSV on 18 October 2026.
- Qatar Tourism press release of 21 January 2026 (link): December 2025, accommodation revenue, business visitors.
- Qatar News Agency, 6 October 2026 (link): the nine-month 2026 total.
- National Planning Council, Third National Development Strategy 2024 to 2030 (PDF, page 18): the 2030 tourism targets.
- Qatar Open Data Portal (tourism direct GDP dataset): direct GDP share, a provisional estimate from Qatar Tourism and Oxford Economics.
- Our calculations (seasonal shares, monthly index, winter and summer occupancy means, 2026 changes, 2030 progress) use the dashboard values in the CSV. Occupancy means are simple averages of monthly rates. Not used: a 2025 Saudi visitor count (no official figure published), cruise passenger totals for the 2025/26 season (not published by Qatar Tourism in the sources we found) and visitor spending for 2024 or 2025 (no official figure found).
Free download: qatar-tourism-statistics.csv, with 259 rows: the headline figures, annual arrivals by port of entry and region, and every monthly arrivals and occupancy value, each with its source.
How to cite this page
Khaleej SEO, “Qatar tourism statistics: 2025 visitors, hotels and the months that matter”, khaleejseo.com/blog/qatar-tourism-statistics/, updated 18 October 2026. The charts may be reused with this credit and a link.
Updates
- 18 October 2026: first published, with 2026 data to September (arrivals) and August (hotels). We update the page when Qatar Tourism releases new monthly or annual figures.
Arabic and English SEO specialists for e-commerce stores, dental clinics and travel companies. Our team has led SEO for some of the largest e-commerce brands in the Gulf, across 7 MENA markets.