Bahrain tourism statistics: 2025 visitors, the Saudi share and the 2026 slowdown
How many tourists visit Bahrain, where they live, how they arrive, how long they stay and what changed in 2026. Official figures from the Bahrain Tourism and Exhibitions Authority, the Ministry of Interior and Civil Aviation Affairs, our analysis and a free CSV with the source of every number.
 The Khaleej SEO team
Published · Updated · 9 min read
Key finding: Bahrain’s tourism is a Saudi weekend market. Of the 15.18 million visitors counted in 2025, 13.11 million (86.3%) lived in Saudi Arabia and 13.43 million (88.5%) arrived by land, over the King Fahd Causeway. The count passed the government’s 2026 target of 14.1 million already in 2024, but the quality targets did not follow: tourists stayed 2.7 nights (the target is 3.5), and 2026 started badly, with passengers at Bahrain International Airport 36.4% lower in the first half than a year earlier and none at all in March.
The figures below come from the Bahrain Tourism and Exhibitions Authority (BTEA) Inbound Tourism Survey, the Ministry of Interior, Civil Aviation Affairs and the Information and eGovernment Authority (iGA), all published on the national open data portal, data.gov.bh. We downloaded every dataset on 20 October 2026 and re-read the cells quoted here. Where we did the arithmetic, we say so. Compiled by the Khaleej SEO research team.
Bahrain tourism at a glance
| Figure | Value | Source and period |
|---|---|---|
| Inbound visitors | 15.18 million (15,180,774), +2.0% | BTEA, 2025 |
| Overnight visitors (tourists) | 7.34 million, +10.95%, 48.4% of visitors | BTEA, 2025 |
| Same-day visitors | 7.84 million, -5.15% | BTEA, 2025 |
| Visitors arriving by land | 13.43 million, 88.5% | BTEA, 2025 |
| Visitors living in Saudi Arabia | 13.11 million, 86.3% | BTEA, 2025 |
| Nights spent by tourists | 20.18 million nights, 2.7 nights on average | BTEA, 2025 |
| Visitor spending | BHD 2,033 million, +7.2% | BTEA, 2025 |
| Average daily spend | BHD 73.0 overnight, BHD 59.6 same-day | BTEA, 2025 |
| Bahrain International Airport passengers | 9.74 million, +4.2%, 1.7% above 2019 | Civil Aviation Affairs, 2025 |
| Airport passengers, January to June 2026 | 2.85 million, -36.4% | Civil Aviation Affairs; the percentage is a Khaleej SEO calculation |
| Accommodation and food services, real growth | -13.4% year on year | iGA national accounts, first quarter 2026 |
| Hotel occupancy | No official national figure; one listed hotel group cites 36.8% in the first half of 2026 against 57.3% | Gulf Hotels Group results release, August 2026 |
How many tourists visit Bahrain?
BTEA counted 15,180,774 inbound visitors in 2025, against 14,881,607 in 2024. That is 2.0% growth and 37.2% more than the 11,061,180 of 2019, the last year before the pandemic. Visitors fell to 1.91 million in 2020 and recovered through 2021 to 2023.
The authority splits visitors into two groups. A tourist, or overnight visitor, is a visitor whose trip includes at least one night; a same-day visitor does not stay overnight.
| Year | All visitors | Overnight visitors | Same-day visitors | Overnight share |
|---|---|---|---|---|
| 2019 | 11,061,180 | 3,848,828 | 7,212,352 | 34.8% |
| 2022 | 9,948,631 | 3,712,060 | 6,236,571 | 37.3% |
| 2023 | 12,406,809 | 5,484,318 | 6,922,491 | 44.2% |
| 2024 | 14,881,606 | 6,617,973 | 8,263,633 | 44.5% |
| 2025 | 15,180,774 | 7,342,476 | 7,838,298 | 48.4% |
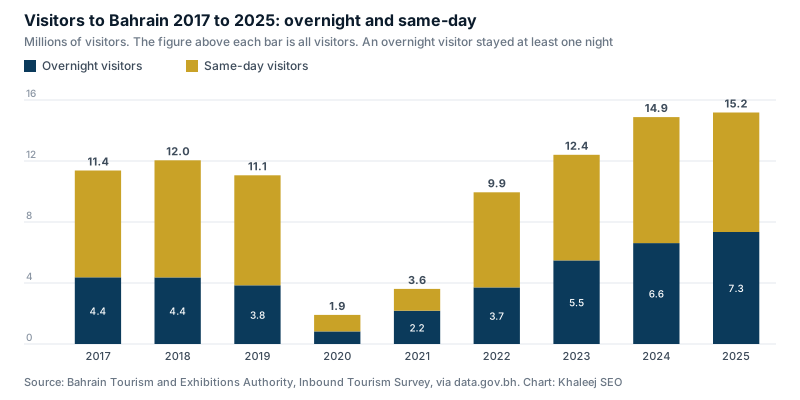
The growth since 2019 is almost all overnight. Overnight visitors rose 90.8% between 2019 and 2025, from 3.85 million to 7.34 million, while same-day visitors rose 8.7%. In 2025 the two moved in opposite directions: overnight visitors grew 10.95% and same-day visitors fell 5.15%. For hotels, apartments and tour operators this is the number that matters, because an overnight visitor needs a bed and a plan for the next day.
Where visitors come from, and how they arrive
BTEA classifies visitors by the country where they live. In 2025, 13,108,004 lived in Saudi Arabia (86.3%) and 1,709,091 in the other GCC countries (11.3%): together 97.6% of all visitors. Europe, Asia and America combined were 2.0%.
| Residence of visitor | 2019 | 2024 | 2025 | 2025 vs 2024 |
|---|---|---|---|---|
| Saudi Arabia | 9,773,664 | 12,825,532 | 13,108,004 | +2.2% |
| Other GCC countries | 964,423 | 1,608,251 | 1,709,091 | +6.3% |
| Europe | 185,962 | 228,749 | 190,049 | -16.9% |
| Asia | 36,256 | 107,412 | 74,545 | -30.6% |
| America | 52,248 | 52,169 | 45,249 | -13.3% |
The distant markets are small and unsteady. Europe fell 16.9% in 2025 and Asia 30.6%, but Europe is still 2.2% above 2019 and Asia is more than twice its 2019 level (2.06 times), because 2024 was a high point. The Saudi share has barely moved: 88.4% in 2019, 86.2% in 2024, 86.3% in 2025.
How they arrive follows from where they live. Of the 2025 visitors, 13,434,183 came by land (88.5%), 1,541,092 by air (10.2%) and 205,499 by sea (1.4%). Land was 87.8% in 2019. The iGA Tourism Survey page says the inbound survey behind these figures is run by interviewing departing tourists at the King Fahd Causeway and at Bahrain International Airport, which puts the road link to Saudi Arabia at the centre of the data.
Border records by nationality tell the same story from a different angle. The Ministry of Interior counted 11,204,569 arrivals of GCC nationals in 2025, of which Saudis made 10,442,937 (93.2%), Kuwaitis 424,997, Qataris 151,940, Emiratis 114,499 and Omanis 70,196. These are arrivals at the border, counted by nationality, so they are not comparable with BTEA’s visitors counted by residence.
Four official numbers for one year
Ask “how many people arrive in Bahrain?” and four official files answer differently. All four are correct for what they count.
| 2025 count | Value | What it counts | Published by |
|---|---|---|---|
| Inbound visitors | 15,180,774 | Visitors estimated from the Inbound Tourism Survey, overnight and same-day | BTEA |
| Arrivals excluding Bahrainis | 16,041,818 | Passengers arriving, Bahraini nationals left out | Ministry of Interior, published by BTEA |
| Passenger arrivals at all ports | 19,654,816 | Everyone arriving by causeway (16,653,820), air (2,790,051) and sea (210,945), Bahrainis included | Ministry of Interior |
| Arrivals of GCC nationals | 11,204,569 | Gulf citizens arriving, 10,442,937 of them Saudi | Ministry of Interior |
Mixing the series produces false collapses. Put the all-ports count for 2023 (17,244,399) next to the GCC-nationals count for 2024 (10,864,490) and visitors appear to fall 37.0% in a year in which BTEA’s visitors rose 19.9%, from 12.41 million to 14.88 million. We found no official note of a change of method between 2023 and 2024 in any dataset description. When you quote a number for Bahrain, name the series.
Does Bahrain have a high season?
Hardly. BTEA’s monthly series shows 2025’s busiest month, January, at 1,485,536 visitors and its quietest, March, at 932,293: a ratio of 1.6 to 1. Four other months, May, July, August and November, each brought 1.3 million or more, and the overnight share stayed between 46.2% (July) and 51.5% (June) in every month. March was also the month that fell furthest behind a year earlier (-10.9%). Visitors come for weekends and holidays all year, so there is no single peak to plan a single campaign around. Our CSV has every month from 2017 to 2025.
How long tourists stay, and what they spend
| Year | Nights spent (million) | Average stay (nights) | Visitor spending (BHD million) | Daily spend, overnight (BHD) |
|---|---|---|---|---|
| 2019 | 13.18 | 3.42 | 1,451 | 71.2 |
| 2022 | 13.03 | 3.5 | 1,467 | 76.0 |
| 2023 | 16.53 | 3.0 | 1,672 | 71.3 |
| 2024 | 19.18 | 2.9 | 1,897 | 69.1 |
| 2025 | 20.18 | 2.7 | 2,033 | 73.0 |
More tourists have brought more nights (+53.2% against 2019) and more spending (+40.1%), but each tourist stays for less time: 3.42 nights in 2019, 2.7 in 2025. Same-day visitors spent BHD 59.6 a day in 2025, against BHD 65.7 in 2019.
Bahrain’s 2022 to 2026 tourism strategy, announced by the Ministry of Industry and Commerce on 6 November 2021, set four numeric goals for 2026. Here is where the latest official figures stand:
| Goal for 2026 | Target | Latest official figure | Status |
|---|---|---|---|
| Tourists | 14.1 million | 14.88 million (2024), 15.18 million (2025) | Passed in 2024 |
| Average stay | 3.5 days | 2.7 nights (2025) | Not met, and moving away: 3.0 in 2023, 2.9 in 2024 |
| Average daily spend | BHD 74.8 | BHD 73.0 for overnight visitors (2025) | Close |
| Tourism share of GDP | 11.4% | No official 2025 figure found; the 2021 release said about 7% | Cannot be tracked |
Press coverage in September 2026 describes 2025 as the year Bahrain passed its target “a year early” (Daily Tribune, 27 September 2026). BTEA’s own series was already above 14.1 million in 2024. The release states the stay target in days while BTEA publishes nights, so the comparison on that row is approximate.
2026 so far: the airport and the hotels
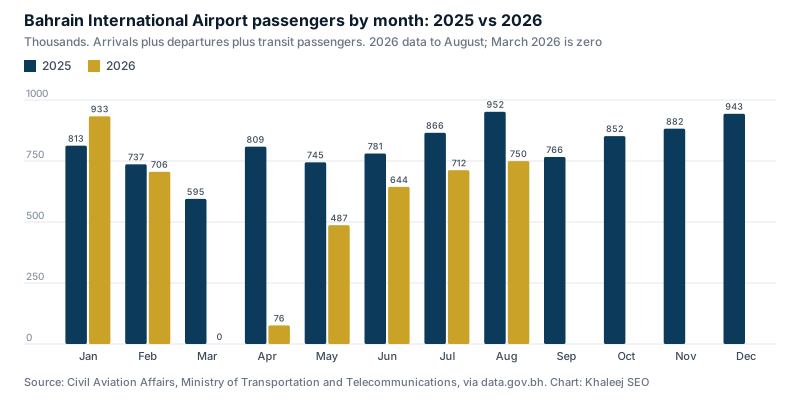
BTEA and Ministry of Interior visitor series end in December 2025 (checked 20 October 2026), so no official 2026 visitor count exists yet. The one monthly series that already carries 2026 data is passengers at Bahrain International Airport, published by Civil Aviation Affairs.
| Month | 2025 | 2026 | Change |
|---|---|---|---|
| January | 812,527 | 933,299 | +14.9% |
| February | 736,625 | 705,610 | -4.2% |
| March | 594,824 | 0 | -100% |
| April | 808,793 | 76,397 | -90.6% |
| May | 744,625 | 487,069 | -34.6% |
| June | 780,771 | 643,725 | -17.6% |
| July | 865,753 | 712,357 | -17.7% |
| August | 951,795 | 749,778 | -21.2% |
| January to June | 4,478,165 | 2,846,100 | -36.4% |
| January to August | 6,295,713 | 4,308,235 | -31.6% |
The dataset prints zero in every column for March 2026. Gulf News reported on 9 April 2026 that flights were resuming in phases after the Kingdom’s airspace reopened and Civil Aviation Affairs cleared airlines to restart (Gulf News). We found no official document that explains the figures, and we add no cause of our own.
Treat the airport as a signal, not a visitor count. In 2025 only 1.54 million visitors arrived by air, while the airport handled 9.74 million passengers including residents and people changing planes. The airport’s 2025 total was a record: 4.2% above 2024 and 1.7% above 2019, and Gulf Daily News quotes the same 9.74 million from Bahrain Airport Company.
The other official 2026 signal is national accounts. Accommodation and food service activities grew 10.3% in real terms in the first quarter of 2025 and shrank 13.4% in the first quarter of 2026 (iGA). That activity covers more than tourism, so it is a pointer, not a tourism measure.
Hotels: no official occupancy figure
Bahrain’s open data portal has no dataset on hotel occupancy, rooms, guests or revenue per room. Searches of the portal’s catalogue for hotel, occupancy, rooms and guests return only a location layer and unrelated datasets (a housing census, wages). What exists:
- A location layer. iGA’s map layer lists 781 hotel and apartment records: 160 hotels (36 five-star, 80 four-star, 24 three-star, 14 two-star, 3 one-star and 3 other) and 621 apartment records. It is a list of places, with no room counts.
- A survey on the way. The iGA Tourism Survey page lists four surveys, including one of tourism establishments to measure supply and economic performance, with fieldwork from November 2025 to December 2027. No results are published yet.
- One company’s statement. Gulf Hotels Group, listed on the Bahrain Bourse, says in its first-half 2026 results (distributed on Zawya on 5 August 2026) that market occupancy fell by approximately 36%, from 57.3% to 36.8%, and revenue per available room by approximately 43%; the group’s own revenue was BHD 12.81 million against BHD 18.69 million. The release does not name who measured the market figures, and it attributes the fall to regional tensions that disrupted air connectivity, traveller confidence and business activity, and to the postponement of the Bahrain Grand Prix. It is a company’s statement, not a national statistic.
Where the official sources disagree
- Four arrival counts for one year (above): 15.18, 16.04 and 19.65 million, and 11.20 million for GCC nationals only.
- Residence is not nationality. BTEA counts 13.11 million visitors living in Saudi Arabia; the Ministry of Interior counts 10.44 million arrivals of Saudi nationals.
- Small differences between files. The 2024 visitor total is 14,881,607 in one BTEA file and 14,881,606 in another, and the 2025 values are printed with decimals (15,180,774.07). We round to whole visitors.
- A duplicated row. In BTEA’s average daily spend file, the “total visitors” row repeats the overnight row in every year. We use the overnight and same-day rows only.
- Tourism’s share of GDP. The 2021 release says about 7% and press in 2026 repeats 7%, but the method is not defined. iGA’s national accounts put accommodation and food services, one activity, at about 1.6% of GDP in the first quarter of 2026. They are not the same measure.
- A printing error. February 2026 airport passengers are printed as 705.61; the components add up to 705,610, which is the value we use.
What this means for hotels, tour operators and travel companies
- Write for Saudi weekend travellers first. Nearly nine visitors in ten live in Saudi Arabia, so Bahrain pages need to answer a Saudi family planning a night or two: how to get there, where to stay, what to do, in Arabic that Saudi readers use rather than a translation. Our Arabic keyword research guide explains how to find that wording, and our SEO services in Saudi Arabia cover the demand on the other side of the causeway.
- Build for short stays. The average tourist stays 2.7 nights and 52% of visitors do not stay overnight at all. One-night and two-night packages, “things to do in 24 hours” pages and clear check-in and parking details match that behaviour better than week-long itineraries.
- Do not plan around Europe or Asia. Together with America they were 2.0% of visitors in 2025. Their numbers swing widely: Europe almost tripled in 2024 (from 76,636 to 228,749 visitors) and fell 16.9% in 2025. They matter for some hotels and tours, and they do not carry the market.
- Plan all year. With no high season, permanent pages for weekends, holidays and events, updated at the same address each year, work better than one-off campaign pages. Our travel and hotel SEO work builds exactly that structure.
- Use the right yardstick for 2026. The airport is not a visitor count and the company occupancy figure is not national. Compare your own bookings, month against the same month a year earlier, and wait for the BTEA series before quoting a market-wide fall.
- Read the neighbours. Our Oman, Qatar and Saudi Arabia tourism statistics show the same seasons and dips at different scales. Our SEO agency in Bahrain page explains how we plan this for Manama and Muharraq businesses.
Want to know whether your site is ready for the Saudi weekend? Ask for a free SEO audit and we will send the issues holding it back within 48 hours.
Methodology and sources
- BTEA, Inbound Tourism Survey, via data.gov.bh: visitors by type of trip, by mode of transport, by country or region of residence, total overnights, average length of stay, visitor expenditure and average daily spend, annual 2017 to 2025, plus the monthly files (by mode and by type of trip).
- Ministry of Interior, via data.gov.bh: arrivals and departures by air, sea and causeway, arrivals of GCC nationals and arrivals excluding Bahrainis (published by BTEA as total arrivals).
- Civil Aviation Affairs, via data.gov.bh: passengers at Bahrain International Airport, annual 2012 to 2025, and the monthly passenger movement to August 2026.
- iGA, via data.gov.bh: quarterly GDP growth by activity and the hotel and apartment location layer; the iGA Tourism Survey page describes the surveys and the fieldwork period.
- Ministry of Industry and Commerce, release “Bahrain introduces new tourism strategy”, 6 November 2021 (page): the 2026 targets.
- Gulf Hotels Group B.S.C., first-half 2026 results release (Zawya, 5 August 2026): the market occupancy figures, labelled as a company statement.
- Press: Gulf News, 9 April 2026 on the airport resuming flights, Daily Tribune, 27 September 2026 on the target, and Gulf Daily News quoting Bahrain Airport Company’s 2025 passenger total, which matches the Civil Aviation Affairs data.
- Our calculations (shares, growth rates, the six-year comparisons, the airport totals and the reconciliation) use the values in the CSV. Airport totals are arrivals plus departures plus transit passengers, which equals the printed total in every month that has one. Not used: official hotel occupancy, rooms or guests (none published), any official 2026 visitor count (none yet), the tourism receipts figure attributed to UN Tourism in the press (the primary document was not found) and event attendance (organiser figures only).
Free download: bahrain-tourism-statistics.csv, with 674 rows: annual series from 2017, monthly visitors from 2017, monthly airport passengers from 2023, quarterly accommodation growth and the 2026 targets, each with its source dataset.
How to cite this page
Khaleej SEO, “Bahrain tourism statistics: 2025 visitors, the Saudi share and the 2026 slowdown”, khaleejseo.com/blog/bahrain-tourism-statistics/, updated 20 October 2026. The charts may be reused with this credit and a link.
Updates
- 20 October 2026: first published, with visitor data to December 2025 and airport data to August 2026. We update the page when BTEA publishes 2026 visitor data, when Civil Aviation Affairs adds September 2026, or when an official hotel dataset appears.
Arabic and English SEO specialists for e-commerce stores, dental clinics and travel companies. Our team has led SEO for some of the largest e-commerce brands in the Gulf, across 7 MENA markets.